
Death Clock: When Will I Die?
This death clock estimates your age at death, the month and year it falls in, and the time left, from your date of birth, sex, country and BMI. It uses 2024 UN life tables and a standard survival formula. The answer is an average for people like you, not a prediction about you.
- UN 2024 data, 201 countries
- Nothing stored or sent
- Free, no sign-up
October 2070 · middle half 77 to 93
On this page
What is a death clock?
A death clock is a life expectancy calculator with a countdown attached. You answer a few questions, it finds people who match your answers in public mortality data, and it shows how long people like that live on average. Then it counts down to that date.
People call it many things: the death clock, a death calculator, a death predictor, a death estimator, a death date calculator or simply a “when will I die calculator”. They all ask the same thing: based on what we know about people like me, how long am I likely to live?
Our death calculator answers with five numbers:
- Estimated age at death. The average age at death for people of your age, sex and country with your answers.
- Projected death date. The month and year when you would reach that age. We stop at the month on purpose.
- Years remaining. The gap between your age today and the estimate.
- The middle half. The range of ages in which the middle 50% of people like you die. This shows how wide the real spread is.
- A live countdown. Years, months, days, hours, minutes and seconds to the projected date.
It also shows what moves your estimate: the changes that would add the most years for you, such as quitting smoking or moving more.
Who runs this death calculator?
Death Clock Calculator is an independent site. It is free, needs no account and is paid for by display ads only. We sell no insurance, supplements, blood tests or subscriptions, so nothing here depends on making your number look scary or certain.
We publish our full method, every constant in the formula and every study behind every input. You can check all of it on how we calculate.
How does the death clock work?
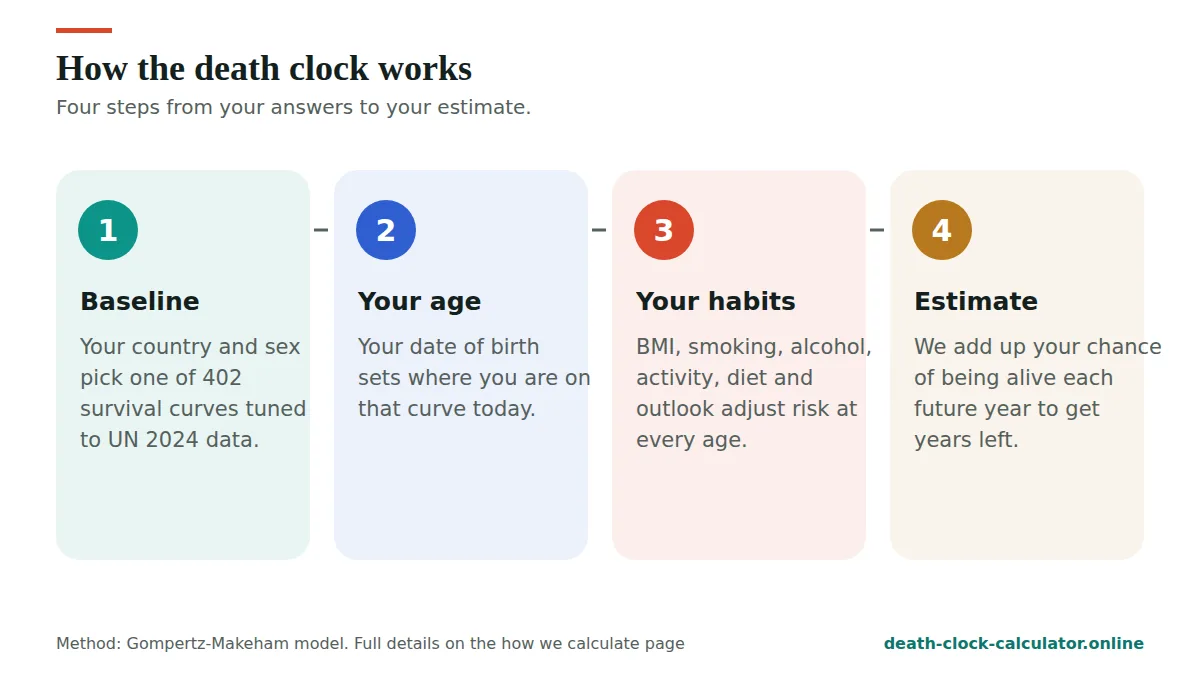
In plain words, it does four things:
- Finds your baseline. Your country and sex pick one of 402 survival curves (201 countries and territories, men and women). Each curve is tuned so it matches that group’s life expectancy at birth and at 65 in the UN’s 2024 figures.
- Starts from your age today. Your date of birth tells the calculator how far along the curve you already are. This step matters a lot, as you will see below.
- Adjusts for your answers. BMI and the optional answers (smoking, alcohol, activity, diet, outlook) make risk at every age a little higher or lower, based on large published studies.
- Works out the average. It adds up your chance of being alive in each future year. That total is your years remaining.
The formula is the Gompertz-Makeham law of mortality. Benjamin Gompertz noticed in 1825 that the risk of dying roughly doubles every eight years or so in adult life. William Makeham added a small, steady background risk in 1860. Actuaries and demographers still use it today because it fits adult death rates well.
When will I die? What the nine questions change
Four questions are required. They set your starting point. Five are optional. Each one nudges the estimate up or down, based on a named study.
| Question | What it does | Evidence |
|---|---|---|
| Date of birth | Sets your age today, the starting point on your survival curve. The biggest single factor. | Calculator input |
| Sex | Picks the men’s or women’s curve for your country. Women live longer in almost every country. | UN World Population Prospects 2024 |
| Country | Sets the baseline level of risk. Countries differ by up to 33 years at birth. | UN World Population Prospects 2024 |
| BMI | Risk is lowest at a BMI of about 20 to 25 and rises on both sides. Each 5 points above 25 raised the death rate by about 31%. | Global BMI Mortality Collaboration, The Lancet, 2016 |
| Smoking | Lifelong smokers died about 10 years sooner than non-smokers. Quitting at 30, 40, 50 or 60 won back about 10, 9, 6 or 3 years. | Doll and Peto, BMJ, 2004 |
| Alcohol | The level with the lowest overall health harm was zero drinks. Risk rises with every extra drink. | GBD 2016 Alcohol Collaborators, The Lancet, 2018 |
| Activity | Compared with no leisure activity, about 75 minutes of brisk walking a week was linked to 1.8 extra years, and the most active group gained about 4.5 years. | Moore and colleagues, PLOS Medicine, 2012 |
| Diet | A Mediterranean diet cut major heart events by about 30% in a large trial. A modelling study linked better diets with years of extra life. | PREDIMED, NEJM, 2018; Fadnes and colleagues, PLOS Medicine, 2022 |
| Outlook | More optimistic people and people with a stronger sense of purpose had lower death rates in long studies. | Lee and colleagues, PNAS, 2019; Alimujiang and colleagues, JAMA Network Open, 2019 |
Some of these studies report a hazard ratio, not years. A hazard ratio of 1.31 means a 31% higher death rate at every age. We convert each one into years by running it through the survival curve. For alcohol, diet and outlook the studies give a direction but no clean years figure, so we use small, careful weights. Our method page lists every weight.
Why is my result higher than my country’s life expectancy?
Because you have already lived part of your life. Life expectancy at birth is an average that includes every baby and young person who dies early. You have already outlived them. So the older you are, the more your estimate rises above the at-birth number.
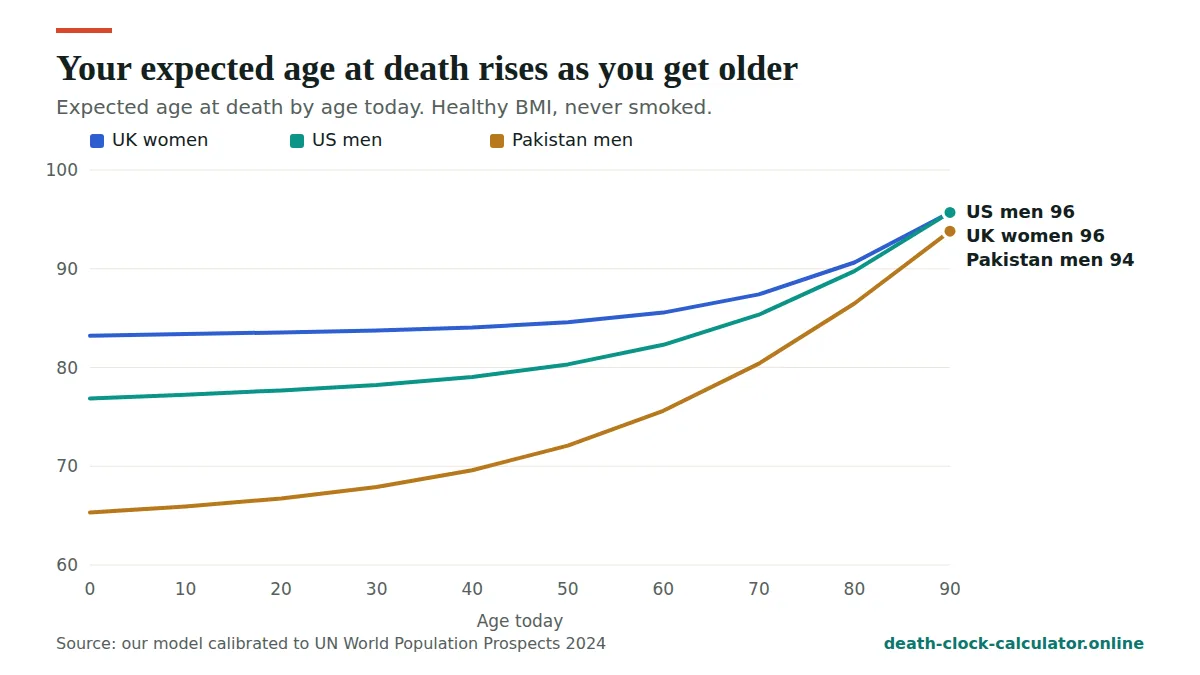
This is called survivorship, and a death clock that skips it gives older people a date that is far too early. Here is how big the effect is in our model:
| Age today | Years remaining | Expected age at death | Above the at-birth figure |
|---|---|---|---|
| 20 | 63.6 | 83.6 | +0.3 |
| 30 | 53.8 | 83.8 | +0.5 |
| 40 | 44.1 | 84.1 | +0.8 |
| 50 | 34.6 | 84.6 | +1.4 |
| 60 | 25.6 | 85.6 | +2.3 |
| 70 | 17.4 | 87.4 | +4.2 |
| 80 | 10.6 | 90.6 | +7.4 |
An 80-year-old woman in the UK can expect to live to about 91, more than seven years past the at-birth figure of 83. The same idea explains why “average life expectancy was 40” in the past did not mean most adults died at 40. Many children died young and pulled the average down.
How much does your country matter?
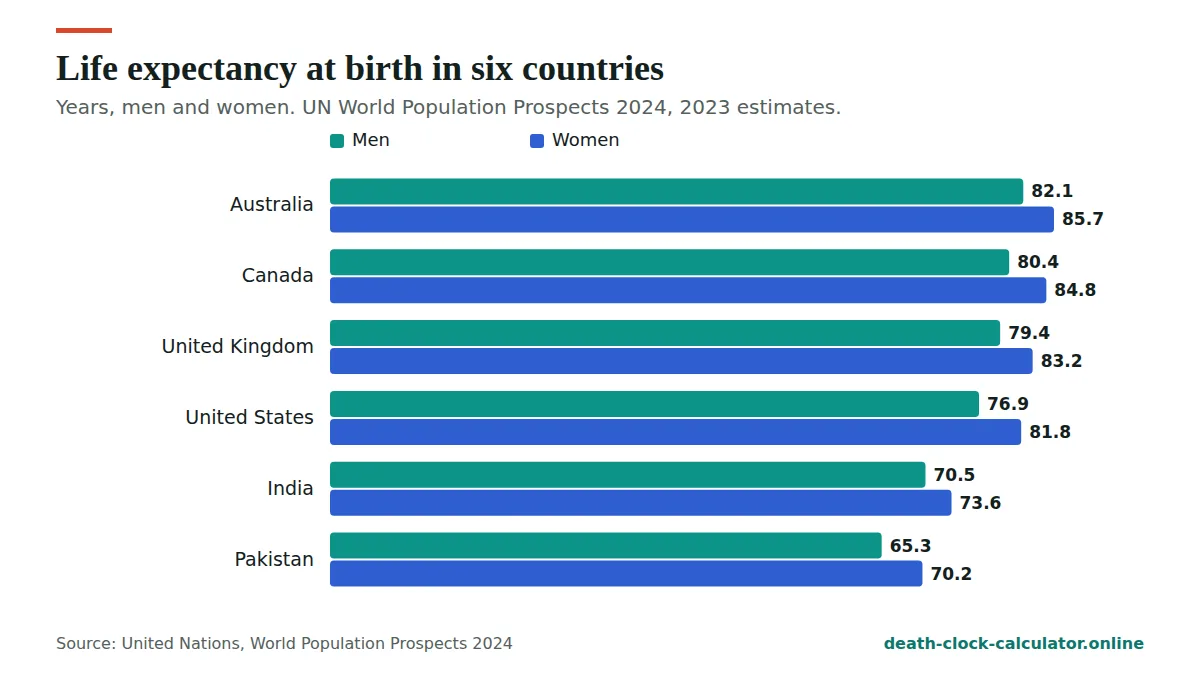
More than any lifestyle choice in this calculator. Across the 201 countries and territories in our data, life expectancy at birth for men runs from about 53 years in Chad to about 83 years in Hong Kong. That is a 30-year gap before we know anything else about you.
| Country | Men | Women | Gap |
|---|---|---|---|
| United States | 76.9 | 81.8 | 5.0 |
| United Kingdom | 79.4 | 83.2 | 3.8 |
| Canada | 80.4 | 84.8 | 4.4 |
| Australia | 82.1 | 85.7 | 3.6 |
| India | 70.5 | 73.6 | 3.1 |
| Pakistan | 65.3 | 70.2 | 4.8 |
Women live longer than men in almost every country. Across our data the average gap is about 5.2 years. You can compare every country on our life expectancy by country page.
A national figure also hides big gaps inside a country, by income, region and access to care. The calculator can’t see those, so read your baseline as “people in my country on average”, not “people on my street”.
How accurate is the death clock?
It is accurate about groups and very uncertain about one person. The averages come from real, published data. But people with exactly your answers die across a wide range of ages. For a healthy 45-year-old American man, the middle half of outcomes runs from about 71 to 90. That is a spread of 19 years.
That is why we show the middle half next to every estimate. If you want the full answer, read is the death clock real or fake?
What this when will I die calculator will not tell you
- An exact day or time. The spread is too wide, so a day would be false precision. We stop at the month.
- A cause of death. A survival curve says nothing about how. Our how will I die guide covers the most common causes by age, as population statistics.
- A medical opinion. It can’t see your health records, family history or genes. A doctor can.
- An AI or psychic reading. There is no artificial intelligence here and no astrology. It is a published formula and public data.
- An accuracy percentage. Any site that says “97% accurate” for one person’s death date is selling something.
More ways to use the death clock
- Death date calculatorQuick answer from your date of birth, shown as a calendar.
- What age will I die?Your age at death and your odds of reaching 70, 80, 90 and 100.
- Death countdownHow many days you have left, with a live timer.
- When will I die quizNine friendly questions, one at a time.
- Is the death clock real?What it gets right, what it can’t know, and the AI question.
- Death clock appAdd it to your phone. Free, private, works offline.
- What is BMI in death clock?Every input explained, with a BMI helper.
- Life expectancy by countryMen and women in 201 countries and territories.
- Life expectancy by ageYears left at every age, from 0 to 90.
- World death clockHow many people die every second worldwide.
- Smoking and life expectancyYears lost, and years won back by quitting.
- How we calculateThe full formula, constants and sources.
Death clock terms in plain English
Frequently asked questions
Is the death clock accurate?
It is accurate for groups and uncertain for one person. The averages come from UN life tables and large published studies. But people with exactly your answers die across a wide range of ages, often 15 years or more. That is why every result shows the middle half range next to the estimate.
Can I use the death clock with just my date of birth?
Almost. You also need your sex, your country and a BMI band, because those set your starting point. If you only want a quick answer from your date of birth, the death date calculator lets you skip BMI and every lifestyle question.
Will I die today?
No calculator can answer that for one person on one day, and this one does not try. For almost everyone reading this, the chance of dying on any single day is very small. If you are asking because you feel frightened or unsafe, please talk to someone right now. The support lines below are free and confidential.
Is this death calculator free and private?
Yes. It is free, with no sign-up. Everything is calculated in your browser, so your date of birth and answers are never sent to us or stored. The site is paid for by ads, and advertisers never see what you type.
Why do women get a later death date than men?
Because women live longer than men in every country in the UN data, by about 5 years on average. Men smoke and drink more in many countries, die more often from injuries and violence, and are less likely to see a doctor early. The calculator uses separate curves for men and women.
Does this death clock use AI?
No. It uses the Gompertz-Makeham formula, first published in 1825 and 1860, with UN data and published studies. There is no artificial intelligence or machine learning. Every constant and weight is listed on our method page, so you can check the maths yourself.
What does the middle half mean?
It is the range of ages in which the middle 50% of people with your answers die. A quarter of them die before the lower age and a quarter after the higher age. It shows how wide the real uncertainty is, which a single date hides.
Can I change my death clock result?
Yes, some of it. Your age, sex and country are fixed, but habits matter. After your result, the “What moves your estimate” panel shows how many years you could gain by stopping smoking, reaching a healthy BMI, exercising more, drinking less or eating better.
How long do people live on average worldwide?
According to UN World Population Prospects 2024, world life expectancy at birth in 2023 was about 70.5 years for men and 75.9 for women. Adults can usually expect to live longer than that, because they have already survived childhood and youth.
When am I going to die?
No one can tell you the exact answer. What the death clock shows is when people with your age, sex, country and habits reach their average age at death, and the range around it. For most adults that range spans 15 years or more.
Is there a perfect death calculator?
No. A perfect death calculator would need to know your genes, health, habits and future luck. The best any tool can do is use good data, adjust for your current age and show an honest range. That is what we aim for, and we publish every step.
How do I know when I will die?
Nobody can know that for sure. The best anyone can do is give an average for people like you and a range around it. That is what the death clock does. Your doctor can tell you much more about your own health than any calculator.
If you are feeling low
If this topic is weighing on you, please talk to someone today. You do not need to be in crisis to call.
- United States: call or text 988 (988 Suicide and Crisis Lifeline)
- United Kingdom and Ireland: Samaritans, call 116 123 for free
- India: Tele-MANAS, call 14416 (free, 24 hours, government of India)
- Anywhere else: findahelpline.com lists free, confidential helplines by country
If you are in danger right now, call your local emergency number.
Sources
- United Nations, Department of Economic and Social Affairs, Population Division. World Population Prospects 2024. population.un.org/wpp
- Global BMI Mortality Collaboration. Body-mass index and all-cause mortality: individual-participant-data meta-analysis of 239 prospective studies in four continents. The Lancet, 2016; 388: 776-786. doi.org/10.1016/S0140-6736(16)30175-1
- Doll R, Peto R, Boreham J, Sutherland I. Mortality in relation to smoking: 50 years’ observations on male British doctors. BMJ, 2004; 328: 1519. doi.org/10.1136/bmj.38142.554479.AE
- GBD 2016 Alcohol Collaborators. Alcohol use and burden for 195 countries and territories, 1990-2016. The Lancet, 2018; 392: 1015-1035. doi.org/10.1016/S0140-6736(18)31310-2
- Moore SC, et al. Leisure time physical activity of moderate to vigorous intensity and mortality: a large pooled cohort analysis. PLOS Medicine, 2012; 9(11): e1001335. doi.org/10.1371/journal.pmed.1001335
- Estruch R, et al. Primary prevention of cardiovascular disease with a Mediterranean diet supplemented with extra-virgin olive oil or nuts. NEJM, 2018; 378: e34. doi.org/10.1056/NEJMoa1800389
- Fadnes LT, et al. Estimating impact of food choices on life expectancy: a modeling study. PLOS Medicine, 2022; 19(2): e1003889. doi.org/10.1371/journal.pmed.1003889
- Lee LO, et al. Optimism is associated with exceptional longevity in 2 epidemiologic cohorts of men and women. PNAS, 2019; 116(37): 18357-18362. doi.org/10.1073/pnas.1900712116
- Alimujiang A, et al. Association between life purpose and mortality among US adults older than 50 years. JAMA Network Open, 2019; 2(5): e194270. doi.org/10.1001/jamanetworkopen.2019.4270
- Gompertz B. On the nature of the function expressive of the law of human mortality. Philosophical Transactions of the Royal Society, 1825; 115: 513-583. Makeham WM. On the law of mortality. Journal of the Institute of Actuaries, 1860; 8: 301-310.
Disclaimer: This death clock gives an educational estimate from population data. It is not medical, financial or insurance advice, and it is not a medical device. See our full disclaimer.