
Life Expectancy Glossary
This life expectancy glossary explains the 32 terms you meet on death clock results, life tables and health reports, in plain English. Each term has a short definition and, where useful, an example from our data. Start with life expectancy at birth and remaining life expectancy: they explain most of what a death clock shows.
- UN 2024 data, 201 countries
- Nothing stored or sent
- Free, no sign-up
On this page
Core terms in this life expectancy glossary
- Life expectancy at birth
- How long a newborn would live on average if today’s death rates stayed the same for its whole life. It is a snapshot of current conditions, not a forecast. Example: about 76.9 years for men in the United States (UN, 2023).
- Remaining life expectancy
- The average number of years left for people who have reached a given age. Also called conditional life expectancy. It is what a good death clock reports.
- Expected age at death
- Your age today plus your remaining life expectancy. It rises as you get older.
- Survivorship
- Reaching an age means you outlived everyone who died before it. This pushes your expected age at death above the at-birth figure.
- Attained age
- The age you have reached today, worked out from your date of birth.
- Period life expectancy
- Life expectancy based on death rates in one period, such as one year. Most published figures, including ours, are period figures.
- Cohort life expectancy
- Life expectancy that also projects future improvements for people born in a given year. It is usually higher than the period figure.
- Healthy life expectancy
- The average number of years lived in good health. It is always lower than life expectancy.
- Lifespan
- The length of one person’s life. Life expectancy is an average; lifespan is what actually happens.
- Longevity
- Living a long life, often used for studies of people who reach very old ages.
Death clock result terms
- Death clock
- A life expectancy calculator with a countdown to the average date of death for people like you.
- Projected death date
- The month and year when people with your answers reach their average age at death.
- Middle half
- The range of ages in which the middle 50% of people with your answers die. A quarter die before it and a quarter after.
- Mean age at death
- The average age at death in a group. Our headline estimate is a mean.
- Median age at death
- The age by which half of a group has died. It is usually a little higher than the mean for adults.
- Percentile
- The age by which a given share of a group has died. The 25th and 75th percentiles mark the middle half.
- Baseline
- Your country’s life expectancy at birth for your sex, before any personal answers.
- Planning horizon
- An age you plan your money to last to, often one that only 1 in 4 or 1 in 10 people reach.
Statistics and model terms
- Life table
- A table showing, for each age, the chance of dying before the next birthday and how many people survive. Insurers and governments use them.
- Survival curve
- A line showing what share of a group is still alive at each age.
- Force of mortality
- The instant risk of dying at a given age, also called the hazard.
- Gompertz-Makeham law
- A formula that describes adult death rates as a steady background risk plus a risk that doubles every few years. It powers our death clock.
- Mortality doubling time
- How many years it takes for the adult death rate to double. Published values are often around 7 to 9 years. We fit it for each country and sex so our curves match UN figures at birth and at 65.
- Hazard ratio
- How much a factor multiplies the death rate. 1.45 means 45% higher; 0.8 means 20% lower.
- Odds ratio
- A comparison of the odds of an outcome between two groups. It is not the same as a hazard ratio.
- Meta-analysis
- A study that pools the results of many studies to get a clearer answer.
- Cohort study
- A study that follows a group of people over time to see what happens to them.
- Crude death rate
- Deaths per 1,000 people in a year, without adjusting for age.
- Age-adjusted death rate
- A death rate recalculated as if every population had the same age mix, so places can be compared fairly.
- Infant mortality rate
- Deaths before age one per 1,000 live births. High infant mortality pulls life expectancy at birth down.
Health terms in the life expectancy glossary
- BMI (body mass index)
- Weight in kilograms divided by height in metres squared. See what BMI means in the death clock.
- Pack-year
- Smoking one pack a day for one year. Twenty a day for twenty years is twenty pack-years.
How to use this life expectancy glossary
You don’t need to read this life expectancy glossary from top to bottom. Most people arrive with one word in mind. Here are a few ways to get the most from it:
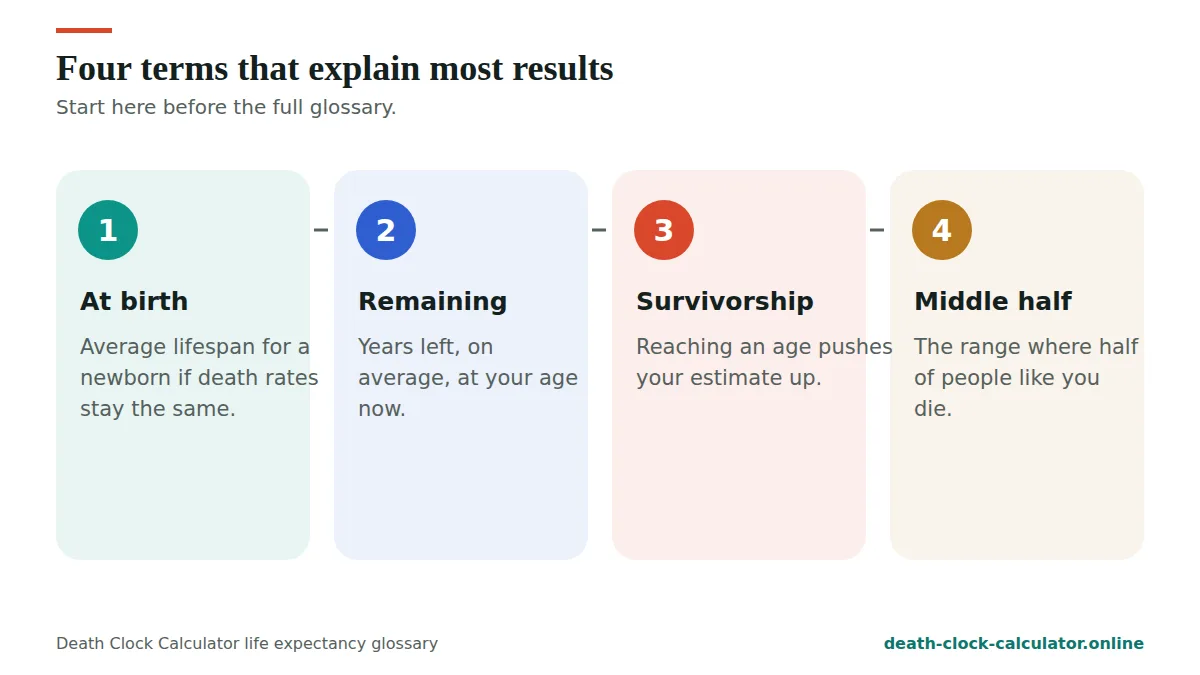
- Start with the core terms. Life expectancy at birth, remaining life expectancy and survivorship explain most of what a death clock shows.
- Look up words from your result. Terms like middle half, percentile and projected death date appear on every result from our death clock.
- Use the examples. Where a term in the life expectancy glossary has an example, it comes from UN data or from our model, so you can see the idea with real numbers.
- Check the pairs that get mixed up. The table further down this life expectancy glossary compares terms that sound alike but mean different things.
The life expectancy glossary in action: one worked example
Definitions in a life expectancy glossary make more sense when you see them used together. Here is how the terms in this life expectancy glossary fit one example: a 40-year-old man in the United States. The model figures are estimates for people with a healthy BMI who have never smoked.
- Baseline. Life expectancy at birth for men in the United States is 76.9 years (UN World Population Prospects 2024, 2023 estimates).
- Attained age. He is 40 today.
- Remaining life expectancy. Our model gives him about 39.1 more years on average.
- Expected age at death. 40 plus 39.1 gives 79.1. That is higher than the baseline because of survivorship.
- Chance of reaching an age. The estimated chance of reaching 90 is about 23%.
Every one of those words has an entry in this life expectancy glossary. Put together, they turn one number into a fair picture: an average, a likely range and the odds of reaching a milestone.
Life expectancy glossary terms people often mix up
Many questions we get come from two words that sound alike. This part of the life expectancy glossary puts the most common pairs side by side.
| Pair | The first means | The second means |
|---|---|---|
| Life expectancy and lifespan | An average for a group | How long one person actually lives |
| Period and cohort life expectancy | Based on death rates in one year | Also projects future improvements for people born in a given year |
| Mean and median age at death | The average age at death | The age by which half the group has died |
| Hazard ratio and odds ratio | How much a factor multiplies the death rate | A comparison of the odds of an outcome between two groups |
| Crude and age-adjusted death rate | Deaths per 1,000 people, with no age adjustment | A rate recalculated as if every population had the same age mix |
| Life expectancy and healthy life expectancy | All years lived on average | Only the years lived in good health |
Of all the pairs in this life expectancy glossary, the one that matters most for a death clock is the first. A life expectancy figure describes thousands of people. It says nothing certain about any one of them.
Why life expectancy at birth can mislead adults
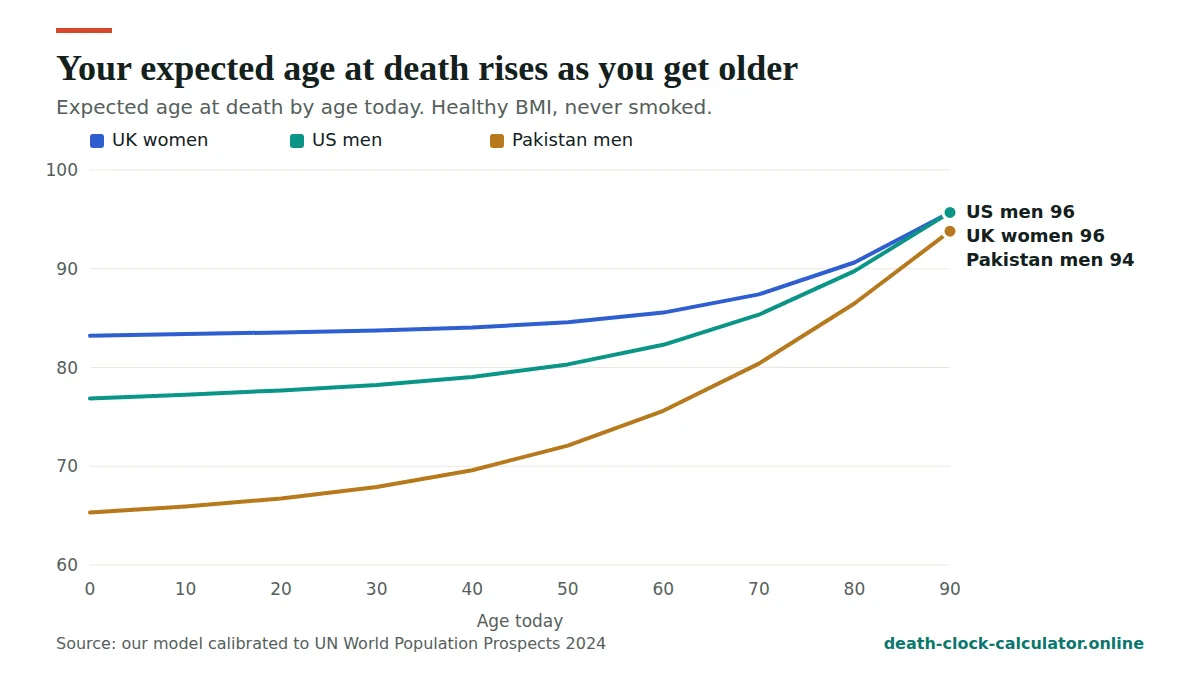
Life expectancy at birth is the most quoted number in this life expectancy glossary, and the easiest to misread. It averages everyone born, including babies and young people who die early. For an adult who has already survived those years, the at-birth figure is too low.
The table shows how the expected age at death rises with age in our model for women in the United Kingdom, whose life expectancy at birth is 83.2. These are estimates for people with a healthy BMI who never smoked.
| Age today | Years remaining | Expected age at death |
|---|---|---|
| 20 | 63.6 | 83.6 |
| 40 | 44.1 | 84.1 |
| 60 | 25.6 | 85.6 |
| 80 | 10.6 | 90.6 |
By age 80, the expected age at death is 7.4 years above the at-birth figure. That is survivorship at work. For more ages and countries, see our guide to life expectancy by age.
How to read a life table, step by step
A life table sounds technical, but it answers simple questions. This life expectancy glossary entry in longer form shows how to read one.
- Find your age. Each row is one age, or a band of ages.
- Look at the chance of dying. This is the chance of dying before the next birthday. It is tiny for young adults and grows with age.
- Look at the survivors. This column shows how many people, out of a starting group, are still alive at that age.
- Read the years remaining. This is the remaining life expectancy at that age.
- Add it to your age. That gives the expected age at death for the group.
Our tools do this for you, using a survival formula fitted to UN figures. You can see the formula on how we calculate.
From hazard ratio to years: an example
Studies usually report a hazard ratio, not years of life. This life expectancy glossary defines a hazard ratio as how much a factor multiplies the death rate. Our model then turns that into a change in years, which is easier to understand.
| BMI band | Hazard ratio | Change in years |
|---|---|---|
| 20 to 24.9 | 1.00 | reference |
| 25 to 27.4 | 1.07 | -0.7 |
| 30 to 34.9 | 1.45 | -3.6 |
| 40 or more | 2.76 | -9.6 |
Notice that a hazard ratio of 1.45 means a 45% higher death rate at every age, but not 45% fewer years. The years lost depend on the baseline and on age. See BMI and life expectancy for the full picture.
Words you will see in data and sources
Some terms in the life expectancy glossary are not about health at all, but about where figures come from. They appear on our data pages and in table captions across the site.
- World Population Prospects. The UN’s main set of population estimates. We use the 2024 release.
- Estimates and projections. Estimates describe years that have passed, such as 2023. Projections describe future years, such as 2026.
- Medium variant. The UN’s central scenario, between its higher and lower ones.
- Territories. Places that are not independent countries but have their own figures, such as Hong Kong. This is why our data covers 201 countries and territories.
- Global Health Estimates. The World Health Organization’s figures for causes of death.
You can download the country figures as a free CSV from data and sources.
Words this life expectancy glossary asks you to handle with care
A few everyday words can give the wrong idea when used about life and death. You won’t find them as entries in the life expectancy glossary, because we try to avoid them, and it helps to notice them elsewhere.
- “Your death date.” No tool knows one person’s date. A projected date is only the middle point of a wide range.
- “Accurate to the day.” Even good data describes groups. For a 25-year-old man in the United States, the middle half of outcomes in our model spans 20 years.
- “Guaranteed years.” Years added by a habit are averages across large groups, not promises.
- “Normal lifespan.” Life expectancy varies widely by country and sex, so there is no single normal.
If words like these on another site have worried you, our death anxiety help page has calm, practical ideas.
What the life expectancy glossary does not cover
This life expectancy glossary sticks to the words you need to read population data and our results. It does not try to define medical conditions, treatments or test results. Those depend on your own health, and a doctor or pharmacist is the right person to explain them.
It also leaves out terms from insurance and pensions that go beyond the basics, such as the details of annuity pricing. If you are making a money decision, a qualified adviser can explain the words in your own documents. For everything about the death clock itself, the life expectancy glossary and our death clock FAQ work well together.
Keep this life expectancy glossary handy
This life expectancy glossary is here whenever a word on a result, a chart or a news story needs explaining. Its terms stay the same across every tool on the site, so once you know them, every page becomes easier to read. For all our tools and guides in one place, visit our death clock resources.
Frequently asked questions
What is the difference between life expectancy and lifespan?
Life expectancy is an average for a group, based on death rates. Lifespan is how long one person actually lives. A person can live far longer or shorter than their group’s life expectancy.
What does life expectancy at birth mean?
It is how long a newborn would live on average if today’s death rates stayed the same for its whole life. It is a snapshot of current conditions, not a forecast for any one baby.
What is remaining life expectancy?
It is the average number of years left for people who have reached a given age. It is higher than you might expect from the at-birth figure, because it only counts people who have survived so far.
What is the difference between period and cohort life expectancy?
Period life expectancy uses death rates from one year, as if they never changed. Cohort life expectancy also projects future improvements for people born in a given year, so it is usually higher. Most published figures, including the UN figures in this life expectancy glossary, are period figures.
What is survivorship in simple words?
Survivorship means that reaching an age shows you have outlived everyone who died before it. Because of this, your expected age at death rises as you get older. In our model, a woman in the United Kingdom aged 80 has an expected age at death of 90.6, well above the at-birth figure of 83.2.
What does a hazard ratio of 1.45 mean?
It means the death rate is 45% higher than in the comparison group, at each age. It does not mean 45% fewer years. The life expectancy glossary example for a BMI of 30 to 34.9 shows a hazard ratio of 1.45 turning into about 3.6 fewer years in our model for a 40-year-old UK man.
Why is median age at death different from the mean?
The mean is the average of all ages at death. The median is the age by which half the group has died. For adults, a few early deaths pull the mean down, so the median is usually a little higher. Both appear in this life expectancy glossary and on our results.
Where can I see these terms used with real numbers?
Try the death clock for your own estimate, then compare it with life expectancy by country. Each result uses the same words as this life expectancy glossary, such as baseline, remaining life expectancy and middle half. Seeing the words next to your own numbers is often the quickest way to learn them.
Put these terms to work with the death clock calculator, or read how we calculate for the full method.
Data: United Nations, World Population Prospects 2024. Method: how we calculate.
See your own estimate in 30 seconds
Free, private and based on UN 2024 data for 201 countries. Nothing you enter is stored.
Open the death clock →