
BMI and Life Expectancy
People with a BMI of about 20 to 25 live the longest on average. Above 25, each 5 extra BMI points raised the death rate by about 31% in a study of 10.6 million adults. In our model, a BMI of 40 or more costs about 10 years for a 40-year-old man. Very low BMI also shortens life.
- UN 2024 data, 201 countries
- Nothing stored or sent
- Free, no sign-up
On this page
Work out your BMI
The link between BMI and life expectancy is strongest in younger adults and in men. Then add your BMI to the death clock calculator to see what it means for your own estimate.
What did the Global BMI Mortality Collaboration find?
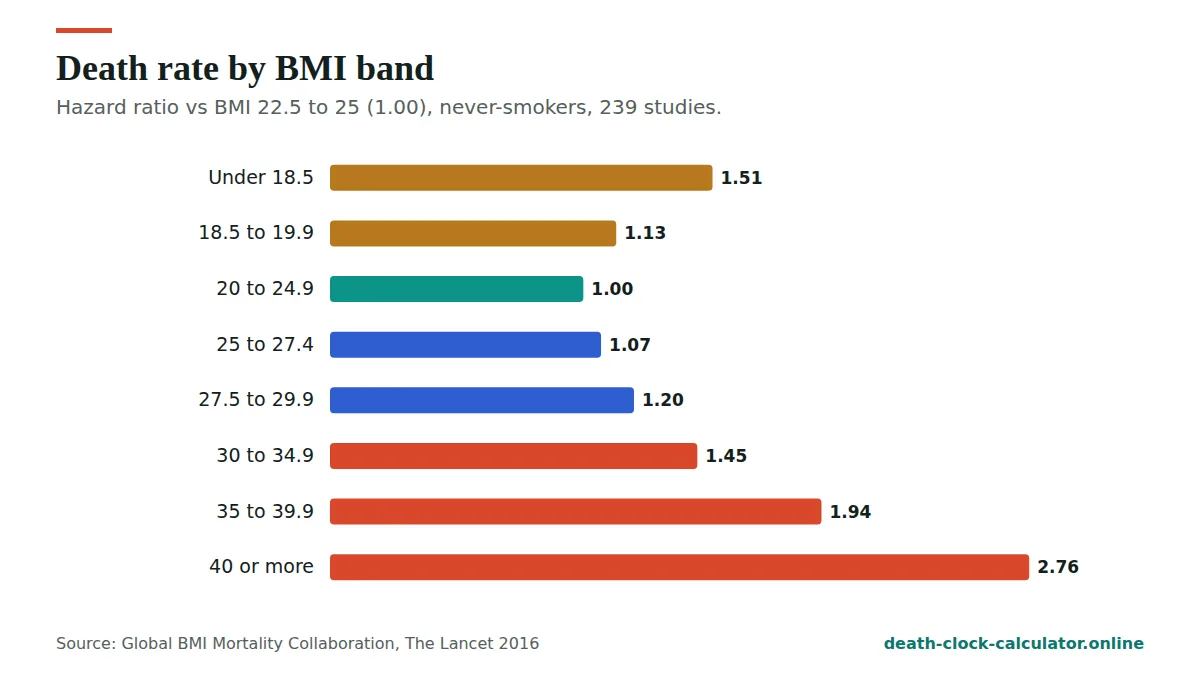
This is the largest study of BMI and death. It pooled data from 239 studies in four continents, covering more than 10 million adults, and was published in The Lancet in 2016. To avoid bias, the main analysis only used never-smokers without major illness at the start, and left out deaths in the first five years.
- The lowest death rates were at a BMI of about 20 to 25.
- Above 25, risk rose steadily: about 31% higher for every 5 BMI points.
- The link was found in Europe, North America, East Asia and Australia and New Zealand.
- The extra risk from high BMI was bigger in younger adults and in men.
BMI and life expectancy: how many years does each band cost?
| BMI band | Hazard ratio used | Men: change in years | Women: change in years |
|---|---|---|---|
| Under 18.5 | 1.51 | -3.9 | -3.9 |
| 18.5 to 19.9 | 1.13 | -1.2 | -1.2 |
| 20 to 24.9 | 1.00 | reference | reference |
| 25 to 27.4 | 1.07 | -0.7 | -0.6 |
| 27.5 to 29.9 | 1.20 | -1.7 | -1.7 |
| 30 to 34.9 | 1.45 | -3.6 | -3.5 |
| 35 to 39.9 | 1.94 | -6.3 | -6.2 |
| 40 or more | 2.76 | -9.6 | -9.5 |
These are model figures, converted from the study’s hazard ratios. A hazard ratio of 1.45 means a 45% higher death rate at every age.
Why are Asian BMI cut-offs lower?
At the same BMI, people of South Asian, East Asian and Southeast Asian origin tend to have more body fat and a higher risk of type 2 diabetes and heart disease. A WHO expert consultation in 2004 suggested extra action points at a BMI of 23 and 27.5 for Asian populations. Many health bodies in India, Pakistan, China and Singapore use lower cut-offs. Tick the Asian option in the BMI tool above to see your band on that scale. More detail is on what is BMI in death clock.
Is BMI a good measure of life expectancy?
It is a quick, useful screen, not a diagnosis. BMI can’t tell muscle from fat, so very muscular people can score high while being healthy. Waist size adds useful information: a larger waist signals more fat around the organs, which carries more risk. A doctor can look at your full picture.
BMI and life expectancy in plain words
The link between BMI and life expectancy is shaped like a shallow “U”. Risk is lowest in the middle, at a BMI of about 20 to 25. It rises slowly on either side at first, and then faster at the far ends.
Studies of BMI and life expectancy describe this with a hazard ratio. It compares the death rate in one group with a reference group. The reference in the big study was a BMI of 22.5 to 25. A hazard ratio of 1.20 means a 20% higher death rate at every age. A hazard ratio of 2.76 means the rate is about 2.8 times as high.
A higher death rate is not the same as a certain outcome. Most people in every BMI band live long lives. The ratios describe what happens on average across very large groups, which is the only honest way to talk about BMI and life expectancy.
How the study was designed, and why it matters
Weight is tangled up with other things that affect health. A good study of BMI and life expectancy has to untangle them, or it can give the wrong answer. The Global BMI Mortality Collaboration made several choices to do that.
| Design choice | Why it matters |
|---|---|
| Only never-smokers in the main analysis | Smoking tends to lower weight and also shortens life, so smokers would make low BMI look worse than it is. |
| No major illness at the start | Illness can cause weight loss, so ill people at a low BMI would blur the picture. |
| First five years of deaths left out | Someone who is already unwell may lose weight before diagnosis. Skipping the early deaths reduces this bias. |
| 239 studies on four continents | A very large, varied group makes the pattern less likely to be a fluke of one country. |
| Data for each person, not just summaries | The same rules could be applied to everyone, so the results are easier to compare. |
These steps are the reason we chose this study for our calculator. Without them, smoking and illness could pull weight down in the comparison group and make the healthy range look riskier than it is.
Why does a low BMI shorten life expectancy?
People often think of BMI and life expectancy only in terms of higher weight. But the study found clear extra risk at the low end too. A BMI under 18.5 had a hazard ratio of 1.51. In our model that is about 3.9 years less for a 40-year-old in the UK who never smoked. A BMI of 18.5 to 19.9 had a smaller ratio of 1.13, or about 1.2 years.
Part of the low end of BMI and life expectancy is explained by illness, which can cause weight loss. Some may reflect less muscle and fewer reserves to recover from an illness or a fall, especially later in life.
So when it comes to BMI and life expectancy, a lower number is not always a better one. If your weight has dropped without you trying, or you find it hard to keep weight on, a doctor can help work out why.
BMI and life expectancy in the overweight range
The overweight range, 25 to 29.9, is where the effect is smallest. A BMI of 25 to 27.4 had a hazard ratio of 1.07, which our model turns into about 0.7 years for men and 0.6 years for women. A BMI of 27.5 to 29.9 had a ratio of 1.20, or about 1.7 years.
For BMI and life expectancy, that is a modest change. It is also where many adults sit. If this is you, there is no reason for alarm. Keeping your weight steady, staying active and eating well already count for a lot.
Obesity and life expectancy: the higher bands
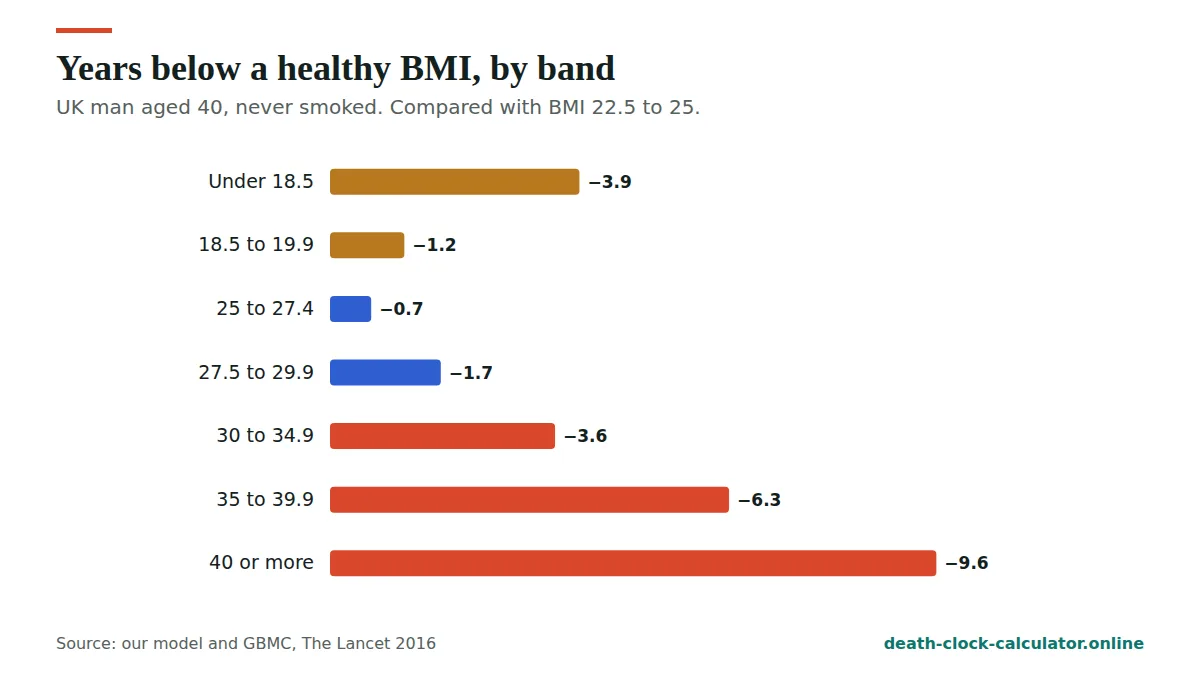
The size of the effect grows in the obesity bands. Here is how BMI and life expectancy line up in our model for a 40-year-old man in the UK who never smoked:
- BMI 30 to 34.9: hazard ratio 1.45, about 3.6 years less than the healthy range.
- BMI 35 to 39.9: hazard ratio 1.94, about 6.3 years less.
- BMI 40 or more: hazard ratio 2.76, about 9.6 years less.
The figures for women are almost the same, within 0.1 years. The link between BMI and life expectancy is clear in these bands, but these are still averages for large groups. Many people with a high BMI live well into old age, and many things other than weight shape a single life.
Why is the effect bigger in younger adults and in men?
The study found the extra risk from a high BMI was larger in younger adults and in men. The reasons are not fully clear. One possible reason is time: a younger person may live with a high BMI for many more years. Another is that other risks are lower in younger adults, so any extra risk stands out more.
BMI and life expectancy compared with smoking
It helps to see BMI and life expectancy next to the habit with the clearest evidence. In the long study of British doctors, lifelong smoking cost about 10 years. In our model, a BMI of 40 or more costs about 9.6 years, and a BMI of 30 to 34.9 about 3.6 years.
| Factor | Years lost, about |
|---|---|
| BMI 25 to 27.4 | 0.7 |
| BMI 27.5 to 29.9 | 1.7 |
| BMI 30 to 34.9 | 3.6 |
| BMI under 18.5 | 3.9 |
| BMI 35 to 39.9 | 6.3 |
| BMI 40 or more | 9.6 |
| Smoking for life | 10 |
The two come from different studies and different methods, so treat the comparison as rough. The details on smoking are on smoking and life expectancy.
Does changing your weight change your life expectancy?
This is a fair question, and the honest answer is that the study can’t fully tell us. It measured BMI once, at the start, and then followed people over time. It compared groups of people at different weights. It did not test what happens when one person’s weight changes. So it can’t say exactly how BMI and life expectancy move together within one person’s life.
Our calculator shows the difference between bands, for example what your estimate would be in the 20 to 24.9 band. That is a guide to the gap between groups, not a promise of years gained. Weight loss that happens without trying is a different matter altogether, and is worth a check with a doctor.
If you do want to change your weight, slow and steady tends to be kinder and easier to keep up. Moving more, eating mostly whole foods and sleeping well help health in their own right, whatever the scale says. There are ideas with good evidence on how to live longer.
How our calculator uses BMI and life expectancy data
The death clock calculator uses the hazard ratios from the study directly. Your BMI band gives a multiplier. That multiplier is applied to your risk of death at every future age, on top of the baseline for your age, sex and country from UN World Population Prospects 2024.
The survival curve then turns the higher or lower risk into years. So the same hazard ratio can be worth a slightly different number of years in different countries and at different ages. The years in the table above are one example of BMI and life expectancy in our model: a 40-year-old in the UK who never smoked.
BMI is combined with any other answers you give, such as smoking or activity. The full formula, and every weight we use, is on how we calculate. If you are not sure which band to choose, what is BMI in death clock explains the input step by step.
What the research on BMI and life expectancy can’t tell you
- It describes groups. A hazard ratio is an average. It can’t say how long any one person will live.
- It is observational. The study watched what happened to people. It did not assign weights, so other factors may still play a part.
- It measured BMI once. Weight over a whole lifetime may matter in ways a single reading can’t show.
- It can’t see where fat sits. Two people with the same BMI can have very different waist sizes and health.
- It covered four continents. The link was reported for Europe, North America, East Asia and Australia and New Zealand. It may fit other regions less well.
So use your result as one sign among many, and read it as a range for people like you.
A calm way to think about weight
Weight is shaped by many things: genes, sleep, stress, medicines, money, work hours and the food around you. It is not a simple measure of effort or of character. Talking about BMI and life expectancy should never be a reason for shame.
If your result worries you, the most useful next step is a normal check-up. A doctor or nurse can look at your blood pressure, waist and overall health, which says far more than one number on a BMI and life expectancy chart. If thinking about lifespan makes you anxious, our death anxiety help page has calm, practical steps.
Frequently asked questions
What BMI lives the longest?
In the Global BMI Mortality Collaboration study, the lowest death rates were at a BMI of about 20 to 25 among never-smokers without major illness.
How much does obesity shorten life?
In our model, based on the study’s hazard ratios, a BMI of 30 to 34.9 costs about 3.5 years for a 40-year-old UK man, and a BMI of 40 or more about 10 years.
Is being underweight bad for life expectancy?
Yes. A BMI under 18.5 had a 51% higher death rate than the reference group in the same study. Sometimes low weight is a sign of illness, so it is worth checking with a doctor.
Is BMI accurate for muscular people?
Not always. BMI can’t tell muscle from fat, so very muscular people can have a high BMI and still be healthy. Waist size is a useful extra check.
Does the link between BMI and life expectancy change for older people?
Not quite. In the Global BMI Mortality Collaboration study, the extra risk from a high BMI was larger in younger adults than in older ones. At older ages, low weight and weight loss become more important to notice. If you are older and losing weight without trying, it is worth talking to a doctor.
Is BMI and life expectancy different for women?
The largest study found the extra risk from a high BMI was larger in men than in women. In our model, the years for each band come out almost the same for both sexes, within about 0.1 years for a 40-year-old in the UK. You can try both in the death clock calculator.
Why did the BMI study leave out smokers?
Smoking tends to lower weight and also shortens life. If smokers were included, low BMI would look riskier and the healthy range would be harder to see. So the main analysis of BMI and life expectancy used only never-smokers without major illness, and left out deaths in the first five years.
Does being a little overweight shorten life?
Only slightly, on average, in the largest study of BMI and life expectancy. A BMI of 25 to 27.4 had a hazard ratio of 1.07. In our model, that is about 0.7 years for a 40-year-old man in the UK who never smoked. Staying active and eating well help your health at any weight.
Can I see my own BMI and life expectancy figure?
Yes. Enter your details in the death clock calculator, then open “What moves your estimate”. If your band is not 20 to 24.9, it shows the modelled change from reaching a healthy BMI. It is an average for people like you, with a wide range, not a prediction.
Sources
- Global BMI Mortality Collaboration. Body-mass index and all-cause mortality: individual-participant-data meta-analysis of 239 prospective studies in four continents. The Lancet, 2016; 388: 776-786. doi.org/10.1016/S0140-6736(16)30175-1
- WHO Expert Consultation. Appropriate body-mass index for Asian populations and its implications for policy and intervention strategies. The Lancet, 2004; 363: 157-163. doi.org/10.1016/S0140-6736(03)15268-3
Compare with the effect of smoking on smoking and life expectancy, or run the full death clock.
See your own estimate in 30 seconds
Free, private and based on UN 2024 data for 201 countries. Nothing you enter is stored.
Open the death clock →