
Life Expectancy by Country
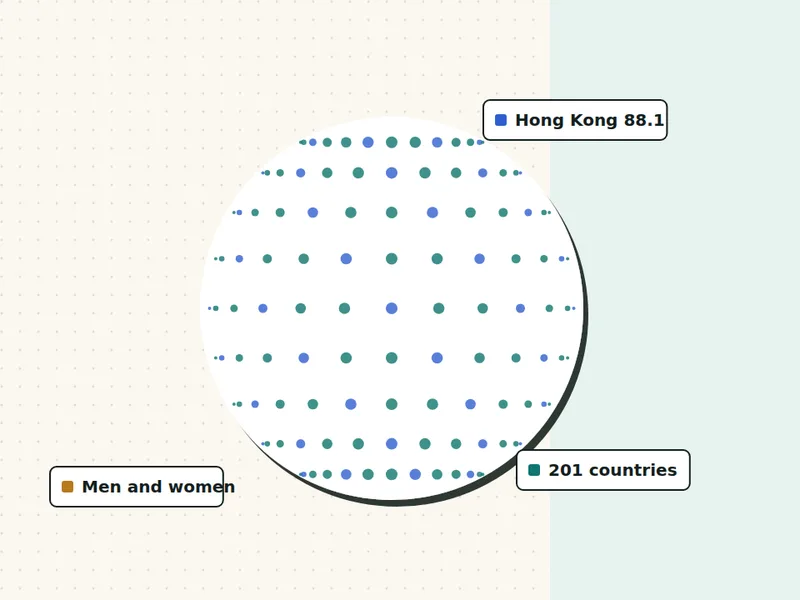
Life expectancy at birth ranges from about 53 years for men in Chad to about 88 years for women in Hong Kong. Worldwide, it is about 71 for men and 76 for women. The table below lists all 201 countries and territories, for men and women, from the UN’s World Population Prospects 2024.
- UN 2024 data, 201 countries
- Nothing stored or sent
- Free, no sign-up
Want a number for you, not your country? Your age and habits change it a lot. Try the death clock calculator, which starts from these figures.
| Country | Men | Women | Gap | Source | Year |
|---|---|---|---|---|---|
| Afghanistan | 64.5 | 67.5 | 3.1 | UN WPP 2024 | 2023 |
| Albania | 77.7 | 81.5 | 3.7 | UN WPP 2024 | 2023 |
| Algeria | 74.9 | 77.7 | 2.8 | UN WPP 2024 | 2023 |
| Angola | 62.1 | 67.1 | 5.0 | UN WPP 2024 | 2023 |
| Antigua and Barbuda | 74.6 | 80.3 | 5.7 | UN WPP 2024 | 2023 |
| Argentina | 74.8 | 79.9 | 5.1 | UN WPP 2024 | 2023 |
| Armenia | 71.4 | 79.5 | 8.1 | UN WPP 2024 | 2023 |
| Aruba | 73.7 | 78.8 | 5.1 | UN WPP 2024 | 2023 |
| Australia | 82.1 | 85.7 | 3.6 | UN WPP 2024 | 2023 |
| Austria | 79.5 | 84.3 | 4.8 | UN WPP 2024 | 2023 |
| Azerbaijan | 71.6 | 77.1 | 5.6 | UN WPP 2024 | 2023 |
| Bahamas | 70.9 | 78.2 | 7.3 | UN WPP 2024 | 2023 |
| Bahrain | 80.7 | 82.0 | 1.3 | UN WPP 2024 | 2023 |
| Bangladesh | 73.0 | 76.4 | 3.3 | UN WPP 2024 | 2023 |
| Barbados | 73.6 | 78.6 | 5.0 | UN WPP 2024 | 2023 |
| Belarus | 69.5 | 79.1 | 9.5 | UN WPP 2024 | 2023 |
| Belgium | 79.9 | 84.3 | 4.5 | UN WPP 2024 | 2023 |
| Belize | 70.9 | 76.5 | 5.6 | UN WPP 2024 | 2023 |
| Benin | 59.4 | 62.2 | 2.9 | UN WPP 2024 | 2023 |
| Bhutan | 71.3 | 75.0 | 3.7 | UN WPP 2024 | 2023 |
| Bolivia | 66.1 | 71.2 | 5.0 | UN WPP 2024 | 2023 |
| Bosnia and Herzegovina | 74.4 | 80.9 | 6.5 | UN WPP 2024 | 2023 |
| Botswana | 66.7 | 71.7 | 5.0 | UN WPP 2024 | 2023 |
| Brazil | 72.8 | 79.0 | 6.2 | UN WPP 2024 | 2023 |
| Brunei | 73.3 | 77.6 | 4.2 | UN WPP 2024 | 2023 |
| Bulgaria | 72.2 | 79.2 | 7.1 | UN WPP 2024 | 2023 |
| Burkina Faso | 58.9 | 63.2 | 4.3 | UN WPP 2024 | 2023 |
| Burundi | 61.6 | 65.7 | 4.1 | UN WPP 2024 | 2023 |
| Cabo Verde | 72.9 | 79.2 | 6.3 | UN WPP 2024 | 2023 |
| Cambodia | 68.0 | 73.2 | 5.2 | UN WPP 2024 | 2023 |
| Cameroon | 61.5 | 65.9 | 4.4 | UN WPP 2024 | 2023 |
| Canada | 80.4 | 84.8 | 4.4 | UN WPP 2024 | 2023 |
| Central African Republic | 55.3 | 59.3 | 4.0 | UN WPP 2024 | 2023 |
| Chad | 53.2 | 57.0 | 3.8 | UN WPP 2024 | 2023 |
| Chile | 79.2 | 83.1 | 3.8 | UN WPP 2024 | 2023 |
| China | 75.2 | 80.9 | 5.7 | UN WPP 2024 | 2023 |
| Colombia | 75.0 | 80.5 | 5.5 | UN WPP 2024 | 2023 |
| Comoros | 64.8 | 68.9 | 4.1 | UN WPP 2024 | 2023 |
| Costa Rica | 78.1 | 83.4 | 5.3 | UN WPP 2024 | 2023 |
| Croatia | 75.4 | 81.7 | 6.3 | UN WPP 2024 | 2023 |
| Cuba | 75.7 | 80.5 | 4.8 | UN WPP 2024 | 2023 |
| Curaçao | 72.5 | 80.8 | 8.4 | UN WPP 2024 | 2023 |
| Cyprus | 79.6 | 83.7 | 4.0 | UN WPP 2024 | 2023 |
| Czechia | 77.0 | 82.6 | 5.6 | UN WPP 2024 | 2023 |
| Côte d'Ivoire | 60.0 | 64.1 | 4.1 | UN WPP 2024 | 2023 |
| DR Congo | 59.8 | 64.0 | 4.3 | UN WPP 2024 | 2023 |
| Denmark | 80.0 | 83.9 | 3.8 | UN WPP 2024 | 2023 |
| Djibouti | 63.5 | 68.5 | 5.0 | UN WPP 2024 | 2023 |
| Dominican Republic | 70.5 | 77.0 | 6.4 | UN WPP 2024 | 2023 |
| Ecuador | 74.7 | 80.1 | 5.5 | UN WPP 2024 | 2023 |
| Egypt | 69.5 | 73.8 | 4.3 | UN WPP 2024 | 2023 |
| El Salvador | 67.5 | 76.3 | 8.7 | UN WPP 2024 | 2023 |
| Equatorial Guinea | 62.0 | 65.7 | 3.6 | UN WPP 2024 | 2023 |
| Eritrea | 66.5 | 70.7 | 4.1 | UN WPP 2024 | 2023 |
| Estonia | 74.9 | 83.0 | 8.1 | UN WPP 2024 | 2023 |
| Eswatini | 61.2 | 67.0 | 5.8 | UN WPP 2024 | 2023 |
| Ethiopia | 64.1 | 70.7 | 6.7 | UN WPP 2024 | 2023 |
| Fiji | 65.3 | 69.4 | 4.0 | UN WPP 2024 | 2023 |
| Finland | 79.2 | 84.7 | 5.5 | UN WPP 2024 | 2023 |
| France | 80.4 | 86.1 | 5.7 | UN WPP 2024 | 2023 |
| French Guiana | 74.1 | 80.0 | 5.9 | UN WPP 2024 | 2023 |
| French Polynesia | 81.8 | 86.5 | 4.7 | UN WPP 2024 | 2023 |
| Gabon | 65.9 | 71.1 | 5.1 | UN WPP 2024 | 2023 |
| Gambia | 64.2 | 67.5 | 3.4 | UN WPP 2024 | 2023 |
| Georgia | 69.6 | 79.1 | 9.5 | UN WPP 2024 | 2023 |
| Germany | 79.0 | 83.8 | 4.7 | UN WPP 2024 | 2023 |
| Ghana | 63.1 | 67.9 | 4.8 | UN WPP 2024 | 2023 |
| Greece | 79.3 | 84.3 | 5.0 | UN WPP 2024 | 2023 |
| Grenada | 72.4 | 78.4 | 6.0 | UN WPP 2024 | 2023 |
| Guadeloupe | 78.1 | 85.5 | 7.4 | UN WPP 2024 | 2023 |
| Guam | 73.4 | 81.4 | 8.0 | UN WPP 2024 | 2023 |
| Guatemala | 70.3 | 74.9 | 4.6 | UN WPP 2024 | 2023 |
| Guinea | 59.5 | 61.9 | 2.4 | UN WPP 2024 | 2023 |
| Guinea-Bissau | 61.7 | 66.4 | 4.7 | UN WPP 2024 | 2023 |
| Guyana | 66.5 | 73.9 | 7.4 | UN WPP 2024 | 2023 |
| Haiti | 61.7 | 68.3 | 6.6 | UN WPP 2024 | 2023 |
| Honduras | 70.4 | 75.5 | 5.2 | UN WPP 2024 | 2023 |
| Hong Kong | 82.8 | 88.1 | 5.3 | UN WPP 2024 | 2023 |
| Hungary | 73.7 | 80.2 | 6.5 | UN WPP 2024 | 2023 |
| Iceland | 81.0 | 84.5 | 3.5 | UN WPP 2024 | 2023 |
| India | 70.5 | 73.6 | 3.1 | UN WPP 2024 | 2023 |
| Indonesia | 69.0 | 73.3 | 4.2 | UN WPP 2024 | 2023 |
| Iran | 75.8 | 79.6 | 3.8 | UN WPP 2024 | 2023 |
| Iraq | 70.4 | 74.1 | 3.6 | UN WPP 2024 | 2023 |
| Ireland | 80.4 | 84.5 | 4.1 | UN WPP 2024 | 2023 |
| Israel | 80.2 | 84.6 | 4.4 | UN WPP 2024 | 2023 |
| Italy | 81.6 | 85.8 | 4.2 | UN WPP 2024 | 2023 |
| Jamaica | 69.0 | 74.0 | 5.0 | UN WPP 2024 | 2023 |
| Japan | 81.7 | 87.7 | 6.1 | UN WPP 2024 | 2023 |
| Jersey | 77.7 | 81.8 | 4.0 | UN WPP 2024 | 2023 |
| Jordan | 75.7 | 80.2 | 4.5 | UN WPP 2024 | 2023 |
| Kazakhstan | 70.1 | 78.4 | 8.3 | UN WPP 2024 | 2023 |
| Kenya | 61.5 | 65.9 | 4.5 | UN WPP 2024 | 2023 |
| Kiribati | 64.6 | 68.2 | 3.6 | UN WPP 2024 | 2023 |
| Kosovo | 75.8 | 80.1 | 4.3 | UN WPP 2024 | 2023 |
| Kuwait | 79.3 | 81.9 | 2.6 | UN WPP 2024 | 2023 |
| Kyrgyzstan | 68.2 | 75.3 | 7.1 | UN WPP 2024 | 2023 |
| Laos | 66.8 | 71.3 | 4.5 | UN WPP 2024 | 2023 |
| Latvia | 71.6 | 80.5 | 8.9 | UN WPP 2024 | 2023 |
| Lebanon | 75.7 | 79.7 | 4.0 | UN WPP 2024 | 2023 |
| Lesotho | 54.6 | 60.0 | 5.4 | UN WPP 2024 | 2023 |
| Liberia | 60.9 | 63.4 | 2.6 | UN WPP 2024 | 2023 |
| Libya | 68.3 | 70.4 | 2.2 | UN WPP 2024 | 2023 |
| Lithuania | 71.2 | 80.7 | 9.5 | UN WPP 2024 | 2023 |
| Luxembourg | 80.6 | 83.8 | 3.3 | UN WPP 2024 | 2023 |
| Macao | 80.8 | 85.3 | 4.4 | UN WPP 2024 | 2023 |
| Madagascar | 61.9 | 65.4 | 3.4 | UN WPP 2024 | 2023 |
| Malawi | 64.1 | 70.6 | 6.5 | UN WPP 2024 | 2023 |
| Malaysia | 74.3 | 79.4 | 5.1 | UN WPP 2024 | 2023 |
| Maldives | 79.7 | 82.8 | 3.1 | UN WPP 2024 | 2023 |
| Mali | 59.0 | 61.9 | 2.9 | UN WPP 2024 | 2023 |
| Malta | 81.3 | 85.3 | 4.0 | UN WPP 2024 | 2023 |
| Martinique | 79.3 | 85.6 | 6.4 | UN WPP 2024 | 2023 |
| Mauritania | 66.5 | 70.5 | 4.0 | UN WPP 2024 | 2023 |
| Mauritius | 71.9 | 78.2 | 6.3 | UN WPP 2024 | 2023 |
| Mayotte | 74.1 | 78.3 | 4.2 | UN WPP 2024 | 2023 |
| Mexico | 72.2 | 77.8 | 5.6 | UN WPP 2024 | 2023 |
| Micronesia | 63.5 | 71.1 | 7.6 | UN WPP 2024 | 2023 |
| Moldova | 66.6 | 75.5 | 9.0 | UN WPP 2024 | 2023 |
| Mongolia | 67.2 | 76.4 | 9.2 | UN WPP 2024 | 2023 |
| Montenegro | 73.7 | 80.3 | 6.6 | UN WPP 2024 | 2023 |
| Morocco | 73.2 | 77.6 | 4.4 | UN WPP 2024 | 2023 |
| Mozambique | 60.3 | 66.5 | 6.2 | UN WPP 2024 | 2023 |
| Myanmar | 63.8 | 70.2 | 6.4 | UN WPP 2024 | 2023 |
| Namibia | 63.3 | 71.3 | 8.0 | UN WPP 2024 | 2023 |
| Nepal | 68.8 | 71.8 | 3.0 | UN WPP 2024 | 2023 |
| Netherlands | 80.5 | 83.7 | 3.2 | UN WPP 2024 | 2023 |
| New Caledonia | 76.3 | 81.3 | 5.0 | UN WPP 2024 | 2023 |
| New Zealand | 80.4 | 83.8 | 3.4 | UN WPP 2024 | 2023 |
| Nicaragua | 72.3 | 77.4 | 5.1 | UN WPP 2024 | 2023 |
| Niger | 60.3 | 62.1 | 1.9 | UN WPP 2024 | 2023 |
| Nigeria | 54.2 | 54.7 | 0.6 | UN WPP 2024 | 2023 |
| North Korea | 71.5 | 75.7 | 4.3 | UN WPP 2024 | 2023 |
| North Macedonia | 75.1 | 79.6 | 4.5 | UN WPP 2024 | 2023 |
| Norway | 81.8 | 84.9 | 3.1 | UN WPP 2024 | 2023 |
| Oman | 78.5 | 81.9 | 3.4 | UN WPP 2024 | 2023 |
| Pakistan | 65.3 | 70.2 | 4.8 | UN WPP 2024 | 2023 |
| Palestine | 59.7 | 71.5 | 11.8 | UN WPP 2024 | 2023 |
| Panama | 76.7 | 82.6 | 5.9 | UN WPP 2024 | 2023 |
| Papua New Guinea | 63.7 | 69.1 | 5.3 | UN WPP 2024 | 2023 |
| Paraguay | 70.9 | 77.0 | 6.1 | UN WPP 2024 | 2023 |
| Peru | 75.4 | 80.1 | 4.7 | UN WPP 2024 | 2023 |
| Philippines | 66.9 | 72.8 | 5.9 | UN WPP 2024 | 2023 |
| Poland | 74.9 | 82.4 | 7.5 | UN WPP 2024 | 2023 |
| Portugal | 79.4 | 85.1 | 5.7 | UN WPP 2024 | 2023 |
| Puerto Rico | 78.0 | 85.2 | 7.2 | UN WPP 2024 | 2023 |
| Qatar | 81.6 | 83.4 | 1.8 | UN WPP 2024 | 2023 |
| Republic of the Congo | 64.1 | 67.5 | 3.3 | UN WPP 2024 | 2023 |
| Romania | 72.4 | 79.6 | 7.2 | UN WPP 2024 | 2023 |
| Russia | 67.3 | 79.0 | 11.8 | UN WPP 2024 | 2023 |
| Rwanda | 65.5 | 69.9 | 4.4 | UN WPP 2024 | 2023 |
| Réunion | 80.5 | 86.3 | 5.8 | UN WPP 2024 | 2023 |
| Saint Lucia | 69.3 | 76.3 | 7.0 | UN WPP 2024 | 2023 |
| Saint Vincent and the Grenadines | 68.7 | 74.3 | 5.7 | UN WPP 2024 | 2023 |
| Samoa | 69.9 | 73.7 | 3.8 | UN WPP 2024 | 2023 |
| Saudi Arabia | 77.1 | 81.2 | 4.1 | UN WPP 2024 | 2023 |
| Senegal | 66.8 | 70.8 | 4.0 | UN WPP 2024 | 2023 |
| Serbia | 73.5 | 80.0 | 6.5 | UN WPP 2024 | 2023 |
| Seychelles | 69.9 | 76.5 | 6.6 | UN WPP 2024 | 2023 |
| Sierra Leone | 60.1 | 63.5 | 3.4 | UN WPP 2024 | 2023 |
| Singapore | 81.2 | 86.2 | 5.0 | UN WPP 2024 | 2023 |
| Slovakia | 75.0 | 81.6 | 6.6 | UN WPP 2024 | 2023 |
| Slovenia | 78.9 | 84.3 | 5.4 | UN WPP 2024 | 2023 |
| Solomon Islands | 69.2 | 72.0 | 2.8 | UN WPP 2024 | 2023 |
| Somalia | 56.4 | 61.4 | 5.0 | UN WPP 2024 | 2023 |
| South Africa | 62.6 | 69.6 | 7.0 | UN WPP 2024 | 2023 |
| South Korea | 81.2 | 87.2 | 6.0 | UN WPP 2024 | 2023 |
| South Sudan | 54.6 | 60.6 | 6.0 | UN WPP 2024 | 2023 |
| Spain | 81.0 | 86.3 | 5.4 | UN WPP 2024 | 2023 |
| Sri Lanka | 74.2 | 80.6 | 6.4 | UN WPP 2024 | 2023 |
| Sudan | 63.3 | 69.6 | 6.4 | UN WPP 2024 | 2023 |
| Suriname | 70.5 | 76.8 | 6.4 | UN WPP 2024 | 2023 |
| Sweden | 81.4 | 85.1 | 3.7 | UN WPP 2024 | 2023 |
| Switzerland | 82.0 | 85.8 | 3.8 | UN WPP 2024 | 2023 |
| Syria | 69.8 | 74.4 | 4.6 | UN WPP 2024 | 2023 |
| São Tomé and Príncipe | 66.2 | 73.7 | 7.5 | UN WPP 2024 | 2023 |
| Taiwan | 77.6 | 83.6 | 6.0 | UN WPP 2024 | 2023 |
| Tajikistan | 69.6 | 74.0 | 4.4 | UN WPP 2024 | 2023 |
| Tanzania | 64.2 | 69.8 | 5.6 | UN WPP 2024 | 2023 |
| Thailand | 72.2 | 80.9 | 8.7 | UN WPP 2024 | 2023 |
| Timor-Leste | 66.1 | 69.4 | 3.4 | UN WPP 2024 | 2023 |
| Togo | 62.5 | 62.9 | 0.4 | UN WPP 2024 | 2023 |
| Tonga | 69.4 | 76.4 | 7.0 | UN WPP 2024 | 2023 |
| Trinidad and Tobago | 70.4 | 76.7 | 6.3 | UN WPP 2024 | 2023 |
| Tunisia | 73.9 | 79.2 | 5.2 | UN WPP 2024 | 2023 |
| Turkmenistan | 66.9 | 72.8 | 6.0 | UN WPP 2024 | 2023 |
| Türkiye | 74.5 | 79.9 | 5.3 | UN WPP 2024 | 2023 |
| Uganda | 65.3 | 71.1 | 5.9 | UN WPP 2024 | 2023 |
| Ukraine | 66.9 | 80.2 | 13.3 | UN WPP 2024 | 2023 |
| United Arab Emirates | 82.0 | 84.2 | 2.2 | UN WPP 2024 | 2023 |
| United Kingdom | 79.4 | 83.2 | 3.8 | UN WPP 2024 | 2023 |
| United States | 76.9 | 81.9 | 5.0 | UN WPP 2024 | 2023 |
| Uruguay | 74.2 | 81.9 | 7.7 | UN WPP 2024 | 2023 |
| Uzbekistan | 69.5 | 75.4 | 6.0 | UN WPP 2024 | 2023 |
| Vanuatu | 69.5 | 73.9 | 4.5 | UN WPP 2024 | 2023 |
| Venezuela | 68.7 | 76.5 | 7.8 | UN WPP 2024 | 2023 |
| Vietnam | 69.9 | 79.3 | 9.4 | UN WPP 2024 | 2023 |
| Western Sahara | 69.7 | 73.6 | 3.9 | UN WPP 2024 | 2023 |
| Yemen | 67.2 | 71.4 | 4.2 | UN WPP 2024 | 2023 |
| Zambia | 63.9 | 68.7 | 4.7 | UN WPP 2024 | 2023 |
| Zimbabwe | 60.2 | 65.0 | 4.8 | UN WPP 2024 | 2023 |
On this page
Life expectancy by country: highest and lowest
| Rank | Highest | Years | Lowest | Years |
|---|---|---|---|---|
| 1 | Hong Kong | 82.8 | Chad | 53.2 |
| 2 | Australia | 82.1 | Nigeria | 54.2 |
| 3 | Switzerland | 82.0 | Lesotho | 54.6 |
| 4 | United Arab Emirates | 82.0 | South Sudan | 54.6 |
| 5 | French Polynesia | 81.8 | Central African Republic | 55.3 |
| 6 | Norway | 81.8 | Somalia | 56.4 |
| 7 | Japan | 81.7 | Burkina Faso | 58.9 |
| 8 | Qatar | 81.6 | Mali | 59.0 |
| 9 | Italy | 81.6 | Benin | 59.4 |
| 10 | Sweden | 81.4 | Guinea | 59.5 |
| Rank | Highest | Years | Lowest | Years |
|---|---|---|---|---|
| 1 | Hong Kong | 88.1 | Nigeria | 54.7 |
| 2 | Japan | 87.7 | Chad | 57.0 |
| 3 | South Korea | 87.2 | Central African Republic | 59.3 |
| 4 | French Polynesia | 86.5 | Lesotho | 60.0 |
| 5 | Réunion | 86.3 | South Sudan | 60.6 |
| 6 | Spain | 86.3 | Somalia | 61.4 |
| 7 | Singapore | 86.2 | Mali | 61.9 |
| 8 | France | 86.1 | Guinea | 61.9 |
| 9 | Switzerland | 85.8 | Niger | 62.1 |
| 10 | Italy | 85.8 | Benin | 62.2 |
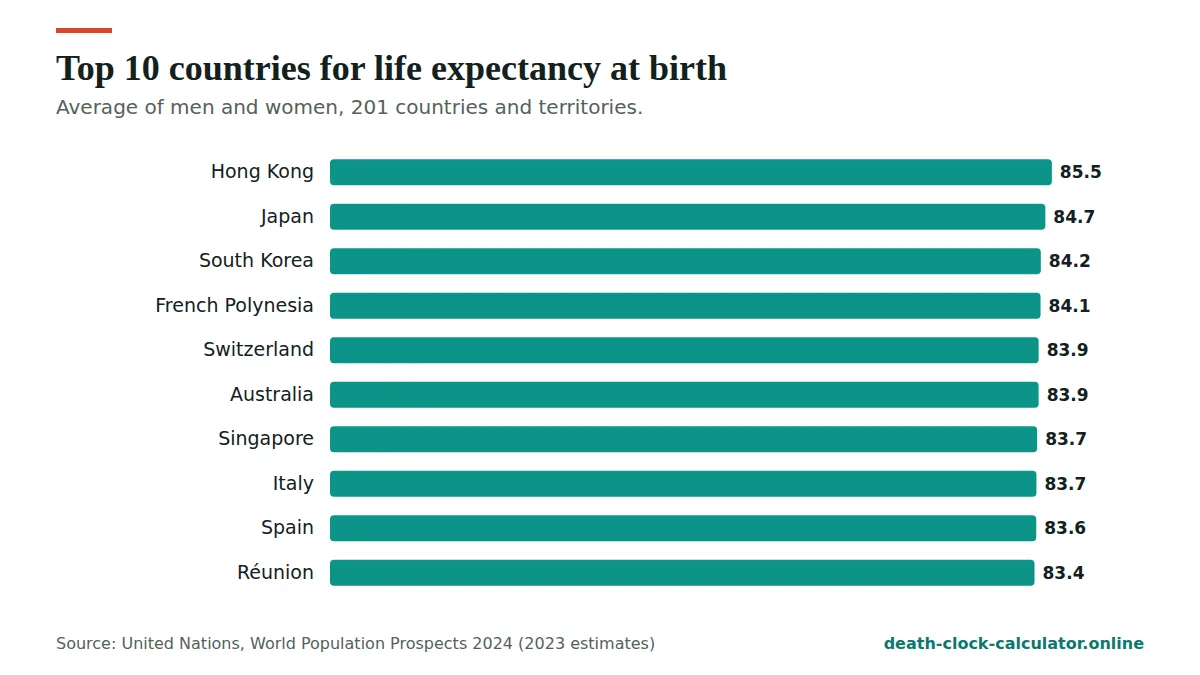
The top of the list is a mix of East Asian, Western European and Pacific places with strong health systems. The bottom is mostly in sub-Saharan Africa, where infections, maternal deaths and child deaths are still more common. Many of the lowest figures have risen quickly over the past 20 years.
Why do women live longer than men?
Women outlive men in every country in the table, by 5.2 years on average. The gap is widest in Ukraine (13.3), Palestine (11.8), Russia (11.8) and narrowest in Bahrain (1.3), Nigeria (0.6), Togo (0.4). Wars, heavy drinking and smoking tend to widen it. Reasons include:
- Men smoke and drink more in many countries.
- Men die more often from injuries, violence and road crashes, especially when young.
- Men are less likely to see a doctor early.
- Some biological protection for women, especially against heart disease before menopause.
Why does my country’s statistics office show a different number?
National statistics offices and the UN often publish slightly different figures. There are three common reasons:
- Different years. A national office may publish a newer year before the UN updates.
- Different methods. The UN uses one consistent method for every country so they can be compared. National offices use their own data and methods.
- Incomplete records. In countries where not every death is registered, the UN has to estimate part of the picture.
We use the UN figures for every country so that the comparison is fair. Each figure shows its source and data year.
How big are the gaps inside one country?
A single national number hides large differences. Richer people, people in cities with good hospitals and people with more education usually live years longer than poorer people in the same country. Some regions within one country differ as much as neighbouring countries do. The death clock can’t see your income or region, so it uses the national average for your sex.
How to read life expectancy by country
It is how long a baby born now would live on average if today’s death rates stayed the same for its whole life. It is a snapshot, not a forecast. It is also pulled down by deaths in infancy and childhood. That is why adults can usually expect to live past it. See life expectancy by age for the figure at your age.
Life expectancy by country at age 65
Life expectancy at birth is the headline number, but it mixes together deaths at every age. Life expectancy at 65 answers a different question: once people reach 65, how many more years do they live on average? For anyone thinking about retirement, this is often the more useful figure.
The UN publishes both numbers for every country, so we can rank life expectancy by country at 65 as well as at birth. Here are the ten highest and the ten lowest.
| Rank | Men | Years left | Women | Years left |
|---|---|---|---|---|
| 1 | Hong Kong | 21.21 | Hong Kong | 25.21 |
| 2 | Réunion | 20.37 | Japan | 24.85 |
| 3 | Australia | 20.32 | Guadeloupe | 23.97 |
| 4 | Switzerland | 20.05 | Réunion | 23.83 |
| 5 | Canada | 20.03 | France | 23.78 |
| 6 | Singapore | 20.03 | South Korea | 23.55 |
| 7 | France | 20.0 | Singapore | 23.53 |
| 8 | Japan | 19.98 | French Polynesia | 23.48 |
| 9 | Iceland | 19.82 | Martinique | 23.43 |
| 10 | New Zealand | 19.72 | Spain | 23.4 |
| Rank | Men | Years left | Women | Years left |
|---|---|---|---|---|
| 1 | Fiji | 10.79 | Nigeria | 12.28 |
| 2 | Lesotho | 11.33 | Togo | 12.43 |
| 3 | Micronesia | 11.59 | Liberia | 12.57 |
| 4 | Mozambique | 11.66 | Chad | 12.75 |
| 5 | Chad | 11.69 | Mali | 12.75 |
| 6 | Burkina Faso | 11.72 | Burkina Faso | 12.87 |
| 7 | Papua New Guinea | 11.74 | Mozambique | 13.14 |
| 8 | Zimbabwe | 11.88 | Sierra Leone | 13.18 |
| 9 | Central African Republic | 11.89 | Fiji | 13.33 |
| 10 | Mali | 11.89 | Niger | 13.34 |
The spread is smaller at 65 than at birth. At birth, the gap between the top and bottom country is about 30 years for men. At 65, it is about 10 years. Many of the deaths that pull down life expectancy at birth in poorer countries happen in childhood and early adult life. People who get past those years close part of the gap.
Hong Kong leads life expectancy by country at 65 for both sexes. A woman there who reaches 65 lives, on average, about 25 more years. Japan, France, South Korea and Spain are also in the top ten for women.
How many countries have a life expectancy over 80?
Grouping life expectancy by country into bands makes the big picture easier to see, because a long ranked list can hide the pattern. We counted how many of the 201 countries and territories fall into each band.
| Life expectancy at birth | Countries (men) | Countries (women) |
|---|---|---|
| 80 or more | 26 | 75 |
| 75 to 79.9 | 35 | 47 |
| 70 to 74.9 | 51 | 37 |
| 65 to 69.9 | 44 | 26 |
| 60 to 64.9 | 33 | 13 |
| Under 60 | 12 | 3 |
A few things stand out in life expectancy by country when you group it this way:
- Women pass 80 in 75 places. Men pass 80 in only 26.
- Most countries sit between 65 and 80. That is true for both sexes.
- Very low figures are rare. Only 12 countries are under 60 for men, and only 3 for women.
The simple average across all 201 countries is about 71.0 years for men and 76.2 for women. The world figure is a little different, because it counts each country by its population. A large country like India moves the world number far more than a small island does.
Life expectancy by country for the places our readers search most
Most people who look up life expectancy by country want to check one or two places they know. This table puts life expectancy by country side by side for twelve of them, at birth and at 65.
| Country | Men at birth | Women at birth | Men at 65 (years left) | Women at 65 (years left) |
|---|---|---|---|---|
| United States | 76.86 | 81.85 | 18.67 | 21.22 |
| United Kingdom | 79.36 | 83.21 | 18.95 | 21.34 |
| Canada | 80.43 | 84.83 | 20.03 | 22.81 |
| Australia | 82.1 | 85.74 | 20.32 | 22.93 |
| Germany | 79.02 | 83.76 | 18.18 | 21.33 |
| France | 80.43 | 86.09 | 20.0 | 23.78 |
| Japan | 81.69 | 87.74 | 19.98 | 24.85 |
| China | 75.2 | 80.93 | 15.55 | 19.34 |
| Bangladesh | 73.03 | 76.37 | 16.61 | 18.42 |
| India | 70.52 | 73.6 | 14.76 | 16.1 |
| Pakistan | 65.33 | 70.16 | 12.84 | 14.75 |
| Nigeria | 54.18 | 54.74 | 11.99 | 12.28 |
Japan has one of the largest gaps between women and men in this group, at about 6 years. Nigeria has one of the smallest, at about half a year. Bangladesh is ahead of India and Pakistan at birth for both sexes.
Country pages with more detail
For six countries we have a full page with tables by age, sex and year of birth:
Where the gap between men and women is widest
Women live longer than men in all 201 places in the UN data. But the size of the gap changes a lot. We worked it out for every country by taking the figure for men away from the figure for women, using life expectancy by country at birth.
| Rank | Widest gap | Years | Narrowest gap | Years |
|---|---|---|---|---|
| 1 | Ukraine | 13.3 | Togo | 0.4 |
| 2 | Palestine | 11.8 | Nigeria | 0.6 |
| 3 | Russia | 11.8 | Bahrain | 1.3 |
| 4 | Georgia | 9.5 | Qatar | 1.8 |
| 5 | Belarus | 9.5 | Niger | 1.9 |
| 6 | Lithuania | 9.5 | Libya | 2.2 |
| 7 | Vietnam | 9.4 | United Arab Emirates | 2.2 |
| 8 | Mongolia | 9.2 | Guinea | 2.4 |
| 9 | Moldova | 9.0 | Liberia | 2.6 |
| 10 | Latvia | 8.9 | Kuwait | 2.6 |
The widest gaps are mostly in Eastern Europe and the former Soviet Union, with Ukraine, Russia, Belarus, Georgia and the Baltic states near the top. Palestine is also high. The narrowest gaps are mostly in West Africa and the Gulf. In Togo and Nigeria, women and men have almost the same figure. The average gap across all countries is about 5.2 years.
The gap is one of the most useful things to look at in life expectancy by country. A large gap does not always mean women are doing very well. Often it means men are dying early, from causes that are more common among men in that place.
How life expectancy by country feeds into your own estimate
Our death clock calculator starts from the life expectancy by country figure for your sex, then adjusts it for your age and habits. The country figure sets the starting level. Your age matters a lot too, because an adult has already lived past the risks of childhood that pull life expectancy by country down.
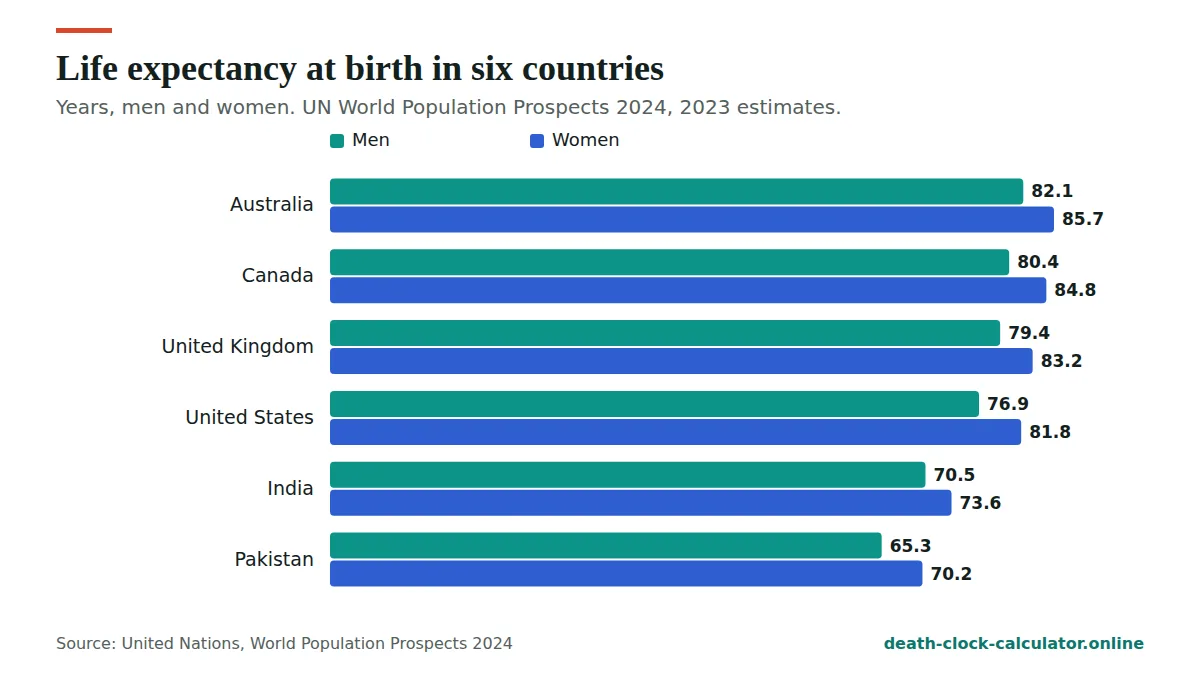
The table below shows what our model gives for a healthy 40-year-old in six countries. These are estimates for people with a healthy BMI who never smoked, calibrated to UN World Population Prospects 2024 (2023 estimates).
| Country | UN at birth, men | Model: healthy 40-year-old man, age at death | UN at birth, women | Model: healthy 40-year-old woman, age at death |
|---|---|---|---|---|
| Australia | 82.1 | 83.3 | 85.7 | 86.4 |
| Canada | 80.4 | 81.9 | 84.8 | 85.7 |
| United Kingdom | 79.4 | 80.8 | 83.2 | 84.1 |
| United States | 76.9 | 79.1 | 81.8 | 83.0 |
| India | 70.5 | 73.4 | 73.6 | 75.7 |
| Pakistan | 65.3 | 69.6 | 70.2 | 73.1 |
In every row, the model estimate for a healthy 40-year-old is higher than the figure at birth. The difference is largest in Pakistan and India, where more deaths happen at young ages, so life expectancy by country understates what a healthy adult there can expect. These are averages for groups. People with the same answers die across a wide range of ages.
How to compare life expectancy by country fairly
Comparing life expectancy by country looks easy, but a few simple checks stop you from drawing the wrong conclusion.
- Compare the same sex. The figure for women is higher almost everywhere, so compare men with men and women with women.
- Compare the same source and year. Every figure on this page is from one UN release, for 2023. Mixing sources can create gaps in life expectancy by country that are not real.
- Look at age 65 as well as birth. Two countries with very different figures at birth can be much closer at 65.
- Remember it is a snapshot. Life expectancy by country uses death rates from one year. It is not a forecast for babies born today.
- Small places move more. In a territory with a small population, a few extra deaths can change the figure noticeably from one year to the next.
What life expectancy by country can’t tell you
Life expectancy by country is a national average. It is useful for comparing places. It is much less useful for predicting one life. Here is what it leaves out:
- Your age. The at-birth figure applies to newborns. Adults usually live past it.
- Your health and habits. Smoking and a very high or very low BMI change the picture a lot. See smoking and life expectancy.
- Where you live inside the country, and your income. Both can matter by several years.
- Future changes. Medicine and living standards keep changing. A baby born today will live under different conditions than the 2023 death rates describe.
So treat life expectancy by country as a starting point, not a verdict. If thinking about these numbers makes you anxious, our death anxiety help page has calm, practical steps.
Why life expectancy by country changes over time
These figures are not fixed. They move as a country’s health, wealth and safety change. The main things that push life expectancy by country up or down are:
- Fewer deaths of babies and young children. This raises the figure at birth more than anything else.
- Better treatment of heart disease, stroke and cancer. This mostly raises the figure at 65.
- Less smoking. This slowly lifts life expectancy, especially for men.
- War, epidemics and economic shocks. These can pull the figure down quickly, sometimes for several years.
When the UN publishes a new edition, the numbers on this page will change. We use one release for every country so that life expectancy by country stays comparable from row to row.
Frequently asked questions
Which country has the highest life expectancy?
In UN World Population Prospects 2024 (2023 estimates), Hong Kong has the highest life expectancy at birth for women, at about 88.1 years, and for men, at about 82.8 years. Japan, South Korea, Switzerland and Australia are also near the top.
Which country has the lowest life expectancy?
Chad has the lowest for men, at about 53.2 years, and Nigeria for women, at about 54.7 years, in the 2023 estimates. Most of the lowest figures are in sub-Saharan Africa.
What is the life expectancy in the United States?
About 76.9 years for men and 81.8 years for women at birth, in UN World Population Prospects 2024 (2023 estimates). US national statistics may show slightly different figures for more recent years.
What is the life expectancy in India and Pakistan?
India: about 70.5 years for men and 73.6 for women. Pakistan: about 65.3 for men and 70.2 for women. Both from UN World Population Prospects 2024, estimates for 2023.
What is the world average life expectancy?
About 70.5 years for men and 75.9 years for women at birth in 2023, according to UN World Population Prospects 2024.
What is life expectancy at 65 by country?
It is the average number of years people live after reaching 65. In UN World Population Prospects 2024 (2023 estimates), Hong Kong is highest, at about 21.2 years for men and 25.2 for women. Fiji is lowest for men, at about 10.8, and Nigeria for women, at about 12.3. See the tables above for life expectancy by country at 65.
Which country has the biggest gap between men and women?
Ukraine, where women live about 13.3 years longer than men at birth, based on UN World Population Prospects 2024 (2023 estimates). Palestine and Russia follow at about 11.8 years. The smallest gaps are in Togo and Nigeria, at under one year. The average across all 201 countries is about 5.2 years.
How many countries have a life expectancy over 80?
For women, 75 of the 201 countries and territories in UN World Population Prospects 2024 (2023 estimates) have a life expectancy at birth of 80 or more. For men, only 26 do. Most countries sit between 65 and 80 for both sexes.
What is the life expectancy in Japan?
About 81.7 years for men and 87.7 years for women at birth, in UN World Population Prospects 2024 (2023 estimates). Japanese women who reach 65 live about 24.9 more years on average, one of the highest figures in the world.
Why is my own estimate higher than life expectancy by country?
The country figure is for newborns, so it includes deaths in childhood and early adult life. If you are an adult, you have already lived past those risks, so the average for people your age is higher. The death clock calculator works this out for your age, sex and habits.
Source
United Nations, Department of Economic and Social Affairs, Population Division (2024). World Population Prospects 2024, medium variant, estimates for 2023. population.un.org/wpp. Territories with fewer than 90,000 people are left out.
Top causes of death also differ by country. See how will I die? for WHO figures by country, age and sex. Or go back to the death clock.
See your own estimate in 30 seconds
Free, private and based on UN 2024 data for 201 countries. Nothing you enter is stored.
Open the death clock →