
Life Expectancy in Canada
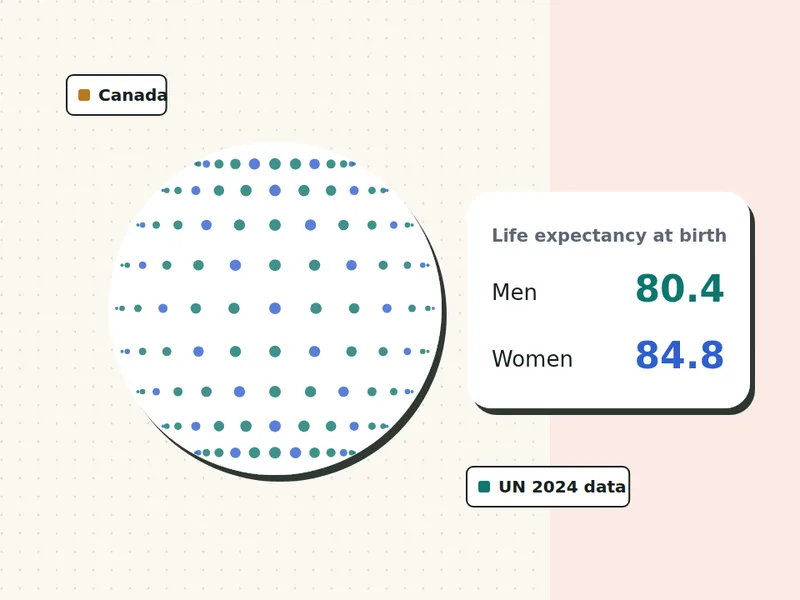
Life expectancy in Canada is about 80.4 years for men and 84.8 years for women at birth, according to UN World Population Prospects 2024 (2023 estimates). Adults can expect to live longer than that: a healthy 40-year-old man in Canada has an expected age at death of about 81.9, and a woman about 85.7. Use the calculator for your own estimate.
UN World Population Prospects 2024, 2023 estimates
- UN 2024 data, 201 countries
- Nothing stored or sent
- Free, no sign-up
On this page
What is the life expectancy in Canada?
At birth, life expectancy in Canada is 80.4 years for men and 84.8 years for women, a gap of 4.4 years. Among the 201 countries and territories in the UN data, that ranks Canada number 21 for men and 20 for women. These are period figures: how long a baby would live if today’s death rates never changed.
Canada has one of the higher life expectancies in the world. Cancers are the leading cause of death, followed by heart disease. Life expectancy is lower in the northern territories than in the southern provinces.
What do official statistics in Canada say?
Statistics Canada reported life expectancy at birth of 81.7 years in 2023: 79.5 years for males and 83.9 for females, up from 81.3 years in 2022.
Source: Statistics Canada, The Daily, 4 December 2024.
National offices often publish newer years or use different methods, so their figures can differ a little from the UN’s. We use the UN figures on our calculator so every country is measured the same way. Read more on data and sources.
Life expectancy by age in Canada
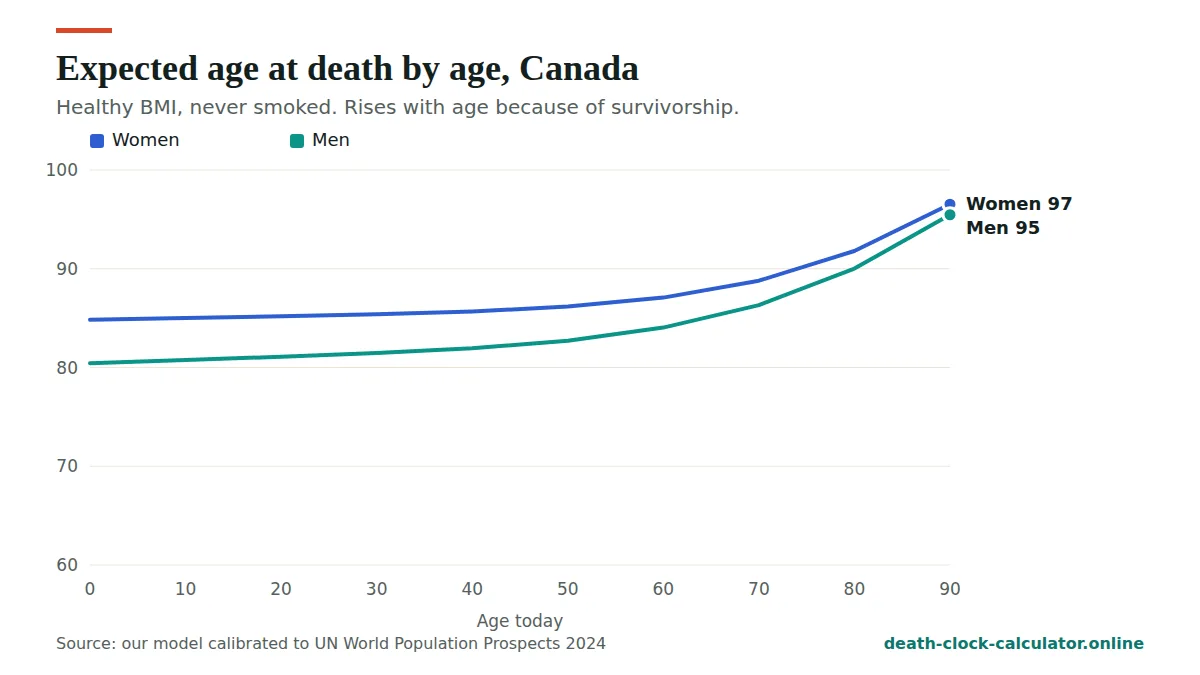
Your life expectancy rises as you get older, because you have already survived the years that pull the average down. The chart and table show our model for healthy non-smokers in Canada.
| Age today | Men: years left | Men: expected age at death | Women: years left | Women: expected age at death |
|---|---|---|---|---|
| 0 | 80.4 | 80.4 | 84.8 | 84.8 |
| 10 | 70.8 | 80.8 | 75.0 | 85.0 |
| 20 | 61.1 | 81.1 | 65.2 | 85.2 |
| 30 | 51.5 | 81.5 | 55.4 | 85.4 |
| 40 | 41.9 | 81.9 | 45.7 | 85.7 |
| 50 | 32.7 | 82.7 | 36.2 | 86.2 |
| 60 | 24.0 | 84.0 | 27.1 | 87.1 |
| 70 | 16.3 | 86.3 | 18.8 | 88.8 |
| 80 | 10.0 | 90.0 | 11.8 | 91.8 |
| 90 | 5.5 | 95.5 | 6.5 | 96.5 |
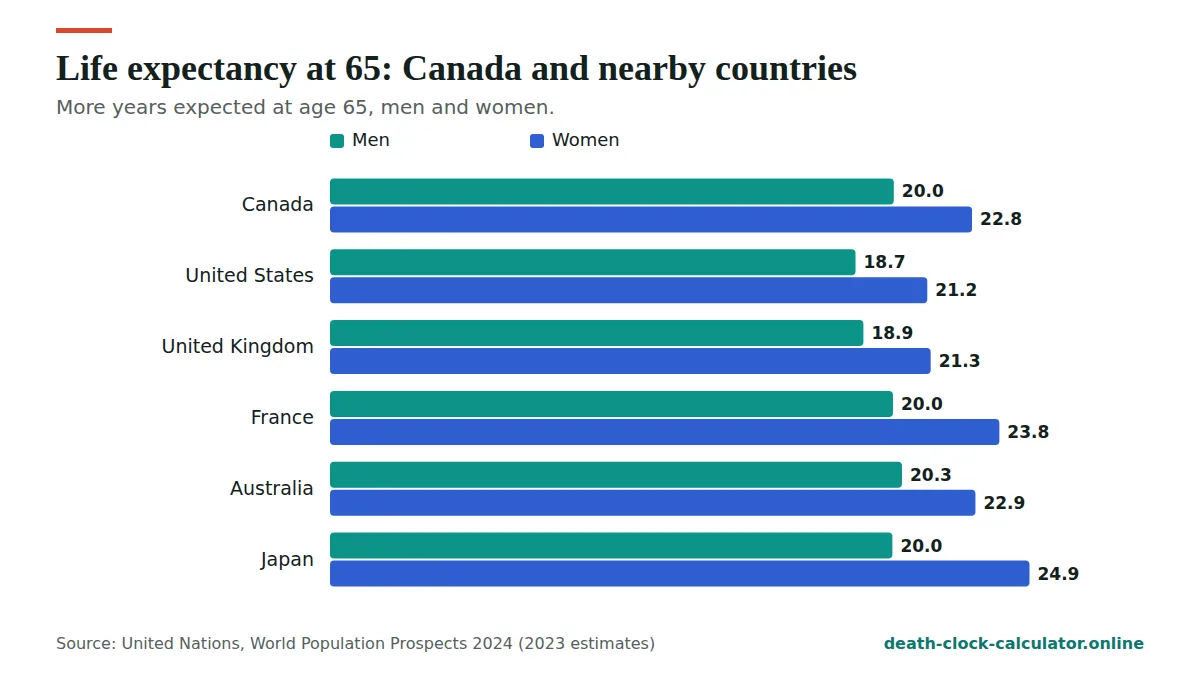
At 65, a healthy man in Canada can expect about 20.0 more years and a woman about 22.8, in our model.
What are the chances of living to 90 in Canada?
For a healthy 40-year-old who has never smoked, our model gives about a 29% chance of reaching 90 for men and 42% for women. Here are the odds for other ages:
| Group | Reach 70 | Reach 80 | Reach 90 | Reach 100 |
|---|---|---|---|---|
| Men | 83% | 62% | 29% | 4% |
| Women | 89% | 72% | 42% | 9% |
What age will people born in Canada live to?
This table shows the expected age at death and the projected year of death for people born in different years, calculated in September 2026 with today’s death rates. People born recently will probably live longer than shown, as health keeps improving.
| Born in | Men: age | Men: year | Women: age | Women: year |
|---|---|---|---|---|
| 1950 | 88 | 2038 | 90 | 2040 |
| 1960 | 85 | 2045 | 88 | 2048 |
| 1970 | 83 | 2053 | 87 | 2057 |
| 1980 | 82 | 2062 | 86 | 2066 |
| 1990 | 82 | 2072 | 86 | 2076 |
| 2000 | 81 | 2081 | 85 | 2085 |
| 2010 | 81 | 2091 | 85 | 2095 |
What are the leading causes of death in Canada?
| Group | Leading causes |
|---|---|
| Men 50 to 69 | Heart disease 16.4%, lung cancer 8.8%, COVID-19 5.3% |
| Men 70 and over | Heart disease 15.8%, dementias 10.3%, lung cancer 6.3% |
| Women 50 to 69 | Lung cancer 12.6%, breast cancer 8.1%, heart disease 7.9% |
| Women 70 and over | Dementias 16.8%, heart disease 13.4%, stroke 6.1% |
2021 was a pandemic year, so COVID-19 ranks higher than it does now. For every age group and country, use our causes of death tool.
What would add the most years in Canada?
In Canada, lung cancer and heart disease top the list in middle age, so not smoking is the single biggest step. Cancer screening, a healthy weight and regular activity also add years.
Run the calculator above and open “What moves your estimate” to see how many years each change is worth for you. Our guide to how to live longer has the evidence for each habit.
How to read life expectancy in Canada
The UN puts life expectancy in Canada at about 80.4 years for men and 84.8 for women at birth. Those numbers are close to what adults can expect, because few Canadians die in childhood or early adulthood. In our model, a healthy 40-year-old man has an expected age at death of about 81.9, only 1.5 years above the figure at birth.
That is very different from countries where many children die young. There, adults can expect to live far longer than the headline suggests. In Canada the headline is already a fair guide for most adults, and the real question is what happens after 60.
So the most useful way to read life expectancy in Canada is to look at the years left at older ages, and at the habits that decide which side of the average you end up on.
Statistics Canada and UN figures for life expectancy in Canada
Two sources give slightly different numbers for the same year. Statistics Canada reported 79.5 years for males and 83.9 for females in 2023. The UN estimate for 2023 is about 80.4 and 84.8. Both say women live about 4.4 years longer than men.
| Source | Men | Women | Gap |
|---|---|---|---|
| Statistics Canada | 79.5 | 83.9 | 4.4 |
| UN World Population Prospects 2024 | 80.4 | 84.8 | 4.4 |
The UN figure is about 0.9 years higher for both sexes. Differences like this are normal. National offices and the UN count population and deaths in their own ways and adjust the data with different methods. Neither is wrong.
We use the UN figure in the calculator so that life expectancy in Canada is measured the same way as every other country. If you want the official Canadian number, use the Statistics Canada one. Statistics Canada also reported that life expectancy in Canada rose from 81.3 years in 2022 to 81.7 in 2023, so the trend is upward again.
Life expectancy in Canada compared with the United States
The United States is the obvious comparison for life expectancy in Canada. At birth, the UN puts Canadian men about 3.6 years ahead of American men, and Canadian women about 3.0 years ahead. At 65 the difference is smaller: about 1.4 years for men and 1.6 years for women. We worked these out from UN World Population Prospects 2024 (2023 estimates).
In other words, a large part of the gap opens before 65. Deaths in young and middle adulthood are more common in the United States than in Canada. You can see the full US picture on life expectancy in the United States.
| Country | Men at birth | Women at birth | Men at 65 | Women at 65 |
|---|---|---|---|---|
| Canada | 80.4 | 84.8 | 20.0 | 22.8 |
| United States | 76.9 | 81.8 | 18.7 | 21.2 |
| United Kingdom | 79.4 | 83.2 | 19.0 | 21.3 |
| France | 80.4 | 86.1 | 20.0 | 23.8 |
| Germany | 79.0 | 83.8 | 18.2 | 21.3 |
| Italy | 81.6 | 85.8 | 19.7 | 22.8 |
| Japan | 81.7 | 87.7 | 20.0 | 24.9 |
Where Canada sits in the G7
Among the seven G7 countries, life expectancy in Canada at birth ranks joint third with France for men and fourth for women. At 65 it does even better. Canadian men have the longest remaining life of the group at 65, just ahead of France and Japan, and Canadian women rank third behind Japan and France.
Across all 201 countries and territories in the UN data, Canada ranks 21st for men and 20th for women at birth. For the years left at 65, it moves up to 5th for men and 15th for women. These ranks are our own count from UN World Population Prospects 2024 (2023 estimates).
Why older Canadian men stand out
The jump from 21st at birth to 5th at 65 is unusual. It means Canadian men who reach retirement age tend to live a long time after it, close to the best life expectancy in the world at that age. The weaker spot for life expectancy in Canada is earlier, in the years between young adulthood and 65, when heart disease and lung cancer take more lives.
Life expectancy in Canada for men and women
For life expectancy in Canada, a gap of 4.4 years at birth is narrower than in most places. The average across the 201 countries and territories in the UN data is 5.2 years, and Canada ranks 132nd for the size of its gap. At 65 the gap is about 2.8 years, very close to the world average of 2.7. We worked out both from UN World Population Prospects 2024 (2023 estimates).
The causes table on this page shows where the difference comes from. In the 50 to 69 group, heart disease is the top cause of death for men, while lung cancer and breast cancer lead for women. After 70, dementias move to the top for women. Men tend to die of heart disease earlier, which is part of why life expectancy in Canada is lower for men.
Life expectancy in Canada at 40, 60 and 80
The age table on this page shows how slowly life expectancy in Canada rises with age. These are estimates from our model for people with a healthy BMI who never smoked:
- At 40: about 81.9 for men and 85.7 for women.
- At 60: about 84.0 for men and 87.1 for women.
- At 80: about 90.0 for men and 91.8 for women.
- At 90: about 95.5 for men and 96.5 for women.
For a healthy 40-year-old, our model gives men an 83% chance of reaching 70 and a 62% chance of reaching 80. For women it is 89% and 72%. About 42% of women and 29% of men reach 90, and 9% of women reach 100.
A healthy 30-year-old Canadian man has about 18,794 days left in our model. You can turn your own estimate into a day count on the death countdown page. Every figure here is an average for a group. Real lives spread widely around it, often by 15 to 20 years in either direction.
Life expectancy in Canada differs by region and income
One national figure hides a lot. Life expectancy in Canada is lower in the northern territories than in the southern provinces, and it also differs between richer and poorer neighbourhoods. The UN gives one number for the whole country, so our calculator cannot adjust for where you live.
If you live in a remote area, getting to a doctor or a screening appointment can take more planning. That is worth doing, because many of the causes of early death in Canada are found and treated more easily when caught early.
Habits that raise life expectancy in Canada
You cannot change life expectancy in Canada as a whole, but you can change your own odds. For Canadians the causes of death table points to a clear list:
- Don’t smoke, or stop now. Lung cancer is the top cause of death for Canadian women aged 50 to 69. See smoking and life expectancy for what quitting at each age is worth.
- Go to cancer screening when invited. Ask your family doctor or a clinic about breast, bowel and cervical screening for your age.
- Keep your blood pressure and cholesterol in check. Heart disease is the top cause for men aged 50 to 69.
- Stay active all year. Long winters make it easy to stop moving. Indoor walking, stairs and home exercise all count.
- Keep alcohol low. Less is better for the heart, the liver and cancer risk.
- Look after your brain as you age. Dementias lead the causes of death for women over 70. Staying active and social, and keeping blood pressure in check, are sensible steps.
The life expectancy calculator starts from life expectancy in Canada for your age and sex, then shows what each of these habits is worth for you. If the numbers worry you, our page on coping with death anxiety has calm, practical steps.
Frequently asked questions
What is the average life expectancy in Canada?
According to UN World Population Prospects 2024, life expectancy at birth in Canada was about 80.4 years for men and 84.8 years for women in 2023. Adults who have already passed childhood and young adulthood can expect to live longer than these figures.
How long do men live in Canada?
Men in Canada have a life expectancy at birth of about 80.4 years. In our model, a healthy 40-year-old man who has never smoked has an expected age at death of about 81.9, and a 65-year-old man can expect about 20.0 more years.
How long do women live in Canada?
Women in Canada have a life expectancy at birth of about 84.8 years. In our model, a healthy 40-year-old woman has an expected age at death of about 85.7, and a 65-year-old woman can expect about 22.8 more years.
Why do women live longer than men in Canada?
Women in Canada live about 4.4 years longer at birth. In most countries, men smoke and drink more, die more often from injuries and heart disease at younger ages, and see doctors less. Some biological protection for women also plays a part.
How can I estimate my own life expectancy in Canada?
Use the calculator on this page. It starts from the UN figure for Canada, adjusts for your age and sex, and applies published effects of BMI, smoking, alcohol, activity, diet and outlook. Everything runs in your browser and nothing is stored.
Why is the UN figure different from the Statistics Canada figure?
For 2023, Statistics Canada reported 79.5 years for males and 83.9 for females, while the UN estimate is about 80.4 and 84.8. The two count people and deaths in their own ways and use different methods. Both agree women live about 4.4 years longer. We use the UN figure so life expectancy in Canada is measured like every other country.
Is life expectancy in Canada higher than in the United States?
Yes. In UN World Population Prospects 2024 (2023 estimates), Canadian men live about 3.6 years longer at birth than American men, and Canadian women about 3.0 years longer. At 65 the lead shrinks to about 1.4 and 1.6 years. See life expectancy in the United States for more.
How long will a 65-year-old live in Canada?
In our model, a healthy 65-year-old man in Canada who never smoked can expect about 20.0 more years, and a woman about 22.8. For the years left at 65, the UN data puts Canadian men 5th of 201 countries and territories. These are averages for groups, and real lives vary widely around them.
What are the chances of living to 100 in Canada?
For a healthy 40-year-old who never smoked, our model gives about a 9% chance of reaching 100 for women and 4% for men. Reaching 90 is far more common: 42% for women and 29% for men. You can see your own odds with the death clock calculator, which starts from life expectancy in Canada.
Compare Canada with every other country on life expectancy by country, or go back to the death clock calculator.
See your own estimate in 30 seconds
Free, private and based on UN 2024 data for 201 countries. Nothing you enter is stored.
Open the death clock →