
Life Expectancy Calculator: How Many Years to Plan For
This life expectancy calculator shows how many years people like you live on average, your chance of reaching 70, 80, 90 and 100, and a planning horizon: the ages that half, a quarter and a tenth of people like you live past. It uses UN 2024 data and published studies, and it is free and private.
- UN 2024 data, 201 countries
- Nothing stored or sent
- Free, no sign-up
on average
On this page
What does this life expectancy calculator show?
It answers the questions people ask when they plan ahead, especially for retirement and savings:
- Years to plan for, on average. Your remaining life expectancy, from your age today.
- A planning horizon. The ages that 50%, 25% and 10% of people with your answers live past.
- Your odds of reaching 70, 80, 90 and 100.
- What moves your estimate. The habits that would add the most years.
It runs on the same model as our death clock, so the numbers always match.
Why plan beyond your average life expectancy?
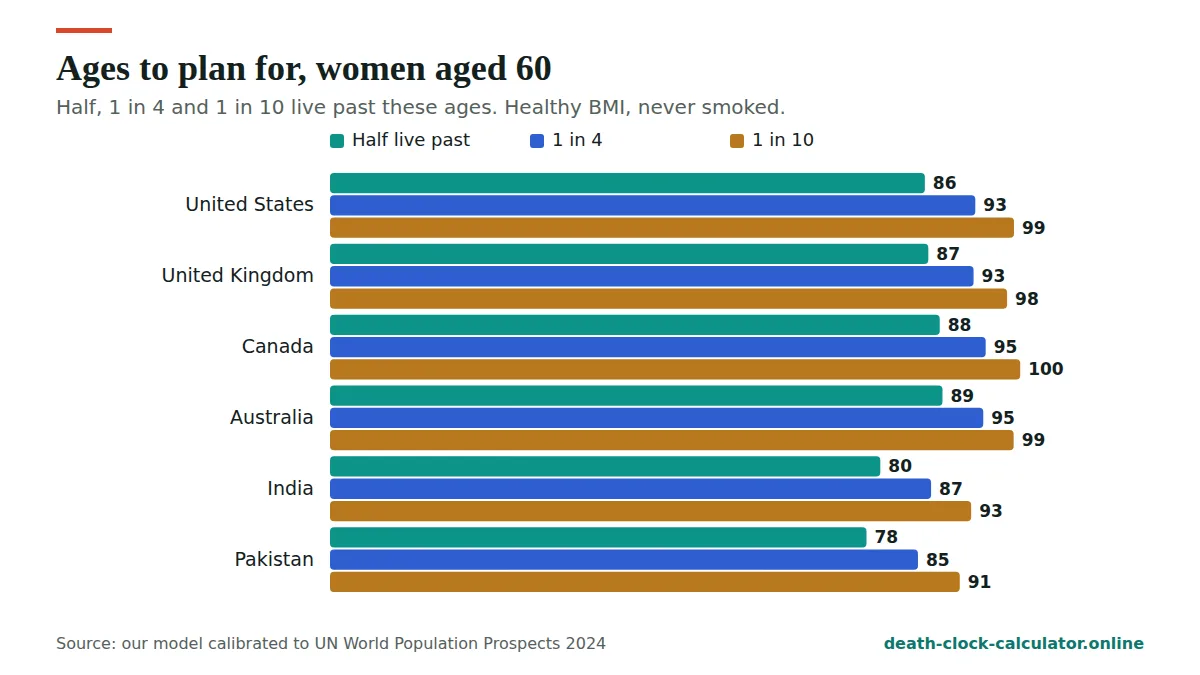
An average means many people live longer. If you plan your savings to last only to the average, there is a real chance you will outlive them. That is why planners often use an age that only 1 in 4 or 1 in 10 people reach. This calculator shows those ages for you. It is not financial advice, so check your plan with a qualified adviser.
How is life expectancy calculated?
We start from UN life expectancy at birth for your country and sex, then use the Gompertz-Makeham survival model to work out how many more years people of your exact age live on average. BMI, smoking and other answers raise or lower risk using published hazard ratios. Every step is on how we calculate.
Life expectancy by age: a quick guide
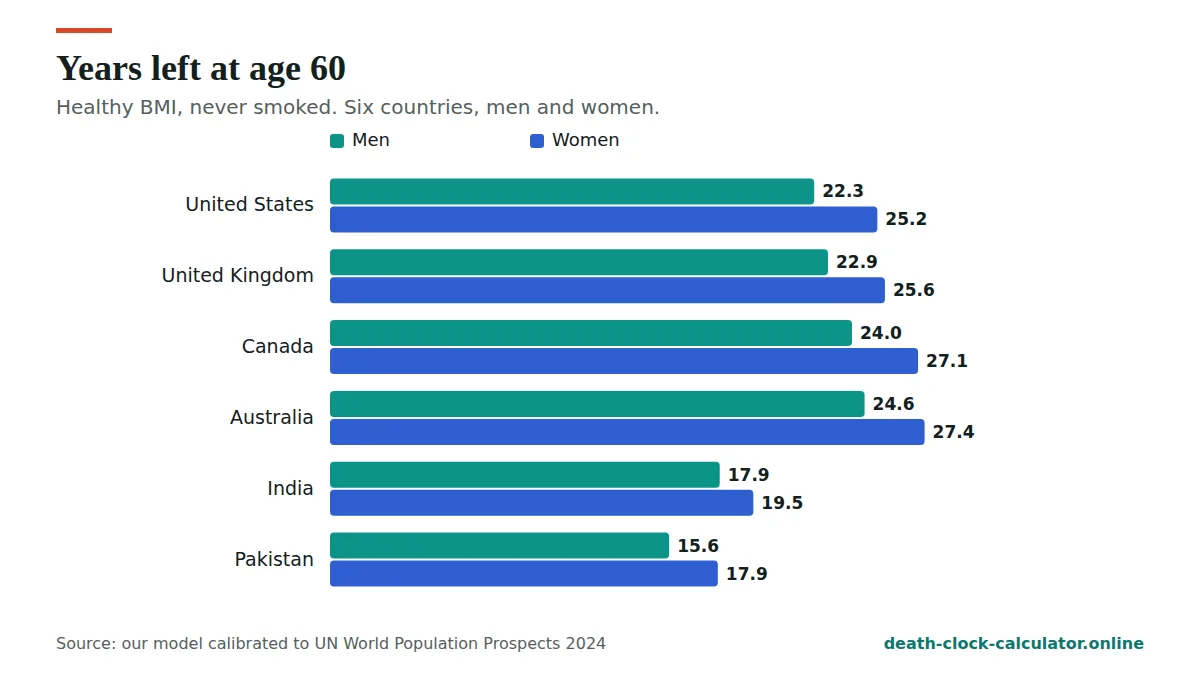
Here are model figures for healthy non-smokers in the United States. For all ages and more countries, see life expectancy by age.
| Age today | Men: years left | Men: expected age at death | Women: years left | Women: expected age at death |
|---|---|---|---|---|
| 0 | 76.9 | 76.9 | 81.8 | 81.8 |
| 5 | 72.0 | 77.0 | 76.9 | 81.9 |
| 10 | 67.2 | 77.2 | 72.0 | 82.0 |
| 15 | 62.5 | 77.5 | 67.2 | 82.2 |
| 20 | 57.7 | 77.7 | 62.3 | 82.3 |
| 25 | 52.9 | 77.9 | 57.4 | 82.4 |
| 30 | 48.2 | 78.2 | 52.6 | 82.6 |
| 35 | 43.6 | 78.6 | 47.8 | 82.8 |
| 40 | 39.1 | 79.1 | 43.0 | 83.0 |
| 45 | 34.6 | 79.6 | 38.4 | 83.4 |
| 50 | 30.3 | 80.3 | 33.8 | 83.8 |
| 55 | 26.2 | 81.2 | 29.4 | 84.4 |
| 60 | 22.3 | 82.3 | 25.2 | 85.2 |
| 65 | 18.7 | 83.7 | 21.2 | 86.2 |
| 70 | 15.3 | 85.3 | 17.5 | 87.5 |
| 75 | 12.4 | 87.4 | 14.2 | 89.2 |
| 80 | 9.8 | 89.8 | 11.2 | 91.2 |
| 85 | 7.5 | 92.5 | 8.6 | 93.6 |
| 90 | 5.7 | 95.7 | 6.4 | 96.4 |
How is this different from an actuarial or insurer calculator?
Insurers and pension schemes use detailed life tables, medical underwriting and sometimes future improvement projections. This calculator uses public period data and a few lifestyle questions. It is a good first guide and a way to see which habits matter, not a quote or an actuarial valuation.
What this calculator can’t know
- Your medical history, family history and genes.
- Your income and where in your country you live, which both matter.
- Future medical progress. Younger people will probably live longer than today’s tables show.
How to use the life expectancy calculator
It takes about a minute. You only need four answers to get a result. The rest are optional.
- Enter your date of birth. The life expectancy calculator uses it to work out your exact age today.
- Choose your sex and country. These pick the UN starting figure for people like you, from 201 countries and territories.
- Enter your height and weight, or your BMI band. A very low or very high BMI changes the result.
- Tell us about smoking. Never smoked, smoke now, or quit at a certain age.
- Add the optional answers if you like. Alcohol, activity, diet and outlook. Each has a “prefer not to say” choice that leaves the result unchanged.
Then read the result from top to bottom. The next section explains each part. Nothing you enter leaves your browser, so you can change an answer and run the life expectancy calculator again as often as you like. Try it with a few different answers to see which ones move your result and which barely change it.
Life expectancy calculator results explained
A good life expectancy calculator gives you more than one number. Ours shows four things, and each answers a different question.
Average years left
This is how many more years people with your answers live on average. Add it to your age to get the expected age at death. It is the middle of a wide spread, not a date on a calendar.
The middle half
Half of people like you die between two ages. We show both. For a healthy 45-year-old man in the United States, that window runs from about 71 to about 90 in our model.
Your chance of reaching 70, 80, 90 and 100
These odds are often easier to think about than an average. They also show how much room there is on both sides of the estimate.
The planning horizon
These are the ages that half, a quarter and a tenth of people like you live past. For money planning, the later ages are usually the safer ones to use.
A life expectancy calculator example, step by step
Here is what the life expectancy calculator returns for one set of answers: a 40-year-old man in the United States with a healthy BMI who never smoked and skips the optional questions.
- Years left: about 39.1.
- Expected age at death: about 79.1.
- Chance of reaching 70: about 76%.
- Chance of reaching 80: about 52%.
- Chance of reaching 90: about 23%.
- Chance of reaching 100: about 4%.
So about half of men like him reach 80, and nearly 1 in 4 reach 90. A woman with the same answers can expect to reach about 83.0, with about a 34% chance of reaching 90. These are estimates for groups of healthy non-smokers, not a forecast for one person.
Life expectancy calculator results in six countries
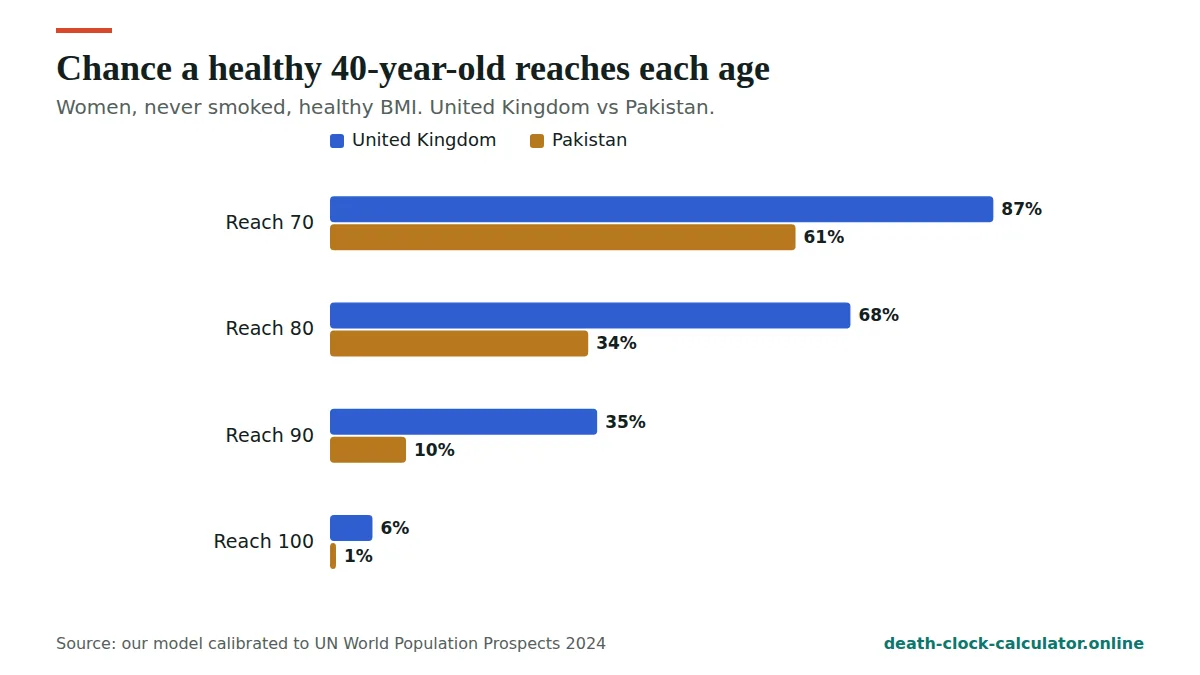
Where you live changes the starting point. This table shows what the life expectancy calculator gives for the same healthy 40-year-old in six countries.
| Country | Men: expected age at death | Women: expected age at death | Men: chance of reaching 90 | Women: chance of reaching 90 |
|---|---|---|---|---|
| Australia | 83.3 | 86.4 | 30% | 43% |
| Canada | 81.9 | 85.7 | 29% | 42% |
| United Kingdom | 80.8 | 84.1 | 24% | 35% |
| United States | 79.1 | 83.0 | 23% | 34% |
| India | 73.4 | 75.7 | 10% | 14% |
| Pakistan | 69.6 | 73.1 | 5% | 10% |
The gap between the top and bottom rows is about 14 years for men and 13 for women. Every figure starts from the UN life expectancy for that country and sex. See life expectancy by country for all 201.
What changes your life expectancy calculator result the most?
Your age, sex and country set the starting point. After that, BMI and smoking move the life expectancy calculator result more than anything else. Here is what our model shows for a 40-year-old in the United Kingdom who never smoked:
| BMI band | Men: change in years | Women: change in years |
|---|---|---|
| Under 18.5 | -3.9 | -3.9 |
| 20 to 24.9 | reference | reference |
| 25 to 27.4 | -0.7 | -0.6 |
| 30 to 34.9 | -3.6 | -3.5 |
| 35 to 39.9 | -6.3 | -6.2 |
| 40 or more | -9.6 | -9.5 |
Smoking for life costs about 10 years in the model. Quitting wins most of that back if you quit early. For UK men who smoked for 30 years or more, quitting at 30 gains about 10.1 years, at 50 about 5.8 and at 70 about 0.8. More detail is on smoking and life expectancy.
The optional answers have smaller, cautious effects. They show the direction of a habit more than an exact number of years. For simple ideas on what to change first, see how to live longer.
How reliable is a life expectancy calculator for one person?
A life expectancy calculator is good at describing groups. It is much less certain about any single life. The honest way to show that is the width of the middle half: the range of ages in which half of people like you die.
| Age today | Estimated age at death | Middle half (25% to 75%) | Width |
|---|---|---|---|
| 25 | 78 | 69 to 89 | 20 years |
| 45 | 80 | 71 to 90 | 19 years |
| 65 | 84 | 76 to 91 | 15 years |
| 85 | 93 | 88 to 96 | 8 years |
For a young adult, the window is about 20 years wide. It narrows with age, but even at 85 it is still about 8 years. That is why we never present a result as a prediction. If a number worries you, our death anxiety help page has calm, practical steps.
Using a life expectancy calculator for retirement planning
Many people use a life expectancy calculator when they plan savings, a pension or when to stop work. A few simple rules help:
- Don’t plan to the average. Half of people live past it. If your money runs out at the average age, there is about a 50% chance you outlive it.
- Use the later planning ages. The ages that 1 in 4 or 1 in 10 people like you reach give a safer margin.
- Plan for a couple, not one person. When two people are planning together, the chance that at least one of them lives to a high age is higher than for either one alone.
- Check again every few years. Your estimate rises as you get older, because you have survived more years of risk.
This is general information, not financial advice. A qualified adviser can turn these ages into a real plan.
Who is this life expectancy calculator for?
Most people who use it fall into one of a few groups:
- People planning retirement or savings, who want a sensible age to plan to.
- People thinking about health changes, who want to see how much BMI or quitting smoking could matter.
- Families and carers, looking at rough averages for an older parent. Keep in mind the result can’t see any illness they may have.
- Students and curious readers, comparing countries or learning how survival works.
It is not a medical test. If you have health worries, a doctor is the right person to ask. Blood pressure, weight and blood sugar can all be checked and are worth knowing.
Tips for a more useful result
- Use your real weight today, not a goal weight.
- If you quit smoking, enter the age you quit. It makes a real difference.
- Choose “prefer not to say” rather than guessing on the optional questions.
- Run the life expectancy calculator a second time with one change, such as a lower BMI, to see what that change is worth.
Why two life expectancy calculators can give different answers
If you try more than one life expectancy calculator, you will likely see different numbers. That does not mean one of them is broken. Common reasons are:
- Different data. Some tools use national tables, some use UN figures, and the year can differ. Ours uses UN World Population Prospects 2024, estimates for 2023, for every country.
- Different questions. A tool that asks about illness, income or family history will move further from the average than one that doesn’t.
- Different weights. The same habit can be given a large or a small effect. We use published hazard ratios where they exist and small, cautious weights where they don’t.
- Future improvement. Some tools assume death rates will keep falling. Ours uses today’s rates, which likely makes estimates for younger people a little low.
Every step, constant and source behind our life expectancy calculator is listed on how we calculate, so you can check it for yourself.
Frequently asked questions
What is a life expectancy calculator?
A life expectancy calculator estimates how many more years people with your age, sex, country and habits live on average. Ours also shows your chance of reaching 70, 80, 90 and 100 and a planning horizon, using UN 2024 data and published studies.
How accurate is a life expectancy calculator?
It is accurate for groups and uncertain for one person. People with the same answers die across a range of many years. That is why we show a planning horizon: the ages that half, a quarter and a tenth of people like you live past.
What age should I plan my retirement savings to?
Many planners suggest planning to an age that only about 1 in 4 or 1 in 10 people like you reach, so money does not run out early. The calculator shows those ages. This is general information, not financial advice, so check with a qualified adviser.
Does the life expectancy calculator store my data?
No. Everything is calculated in your browser. Your date of birth, weight and answers are never sent to us or saved.
Is this the same as the death clock?
It uses the same model and data, so the numbers match. The death clock shows a date and countdown; this page focuses on years to plan for and your odds of reaching each age.
How do I use a life expectancy calculator?
Enter your date of birth, sex and country, then your BMI and smoking history. Optional questions about alcohol, activity, diet and outlook can be skipped. The life expectancy calculator then shows your average years left, the middle half of likely ages, your odds of reaching 70 to 100 and a planning horizon.
What is the life expectancy of a healthy 40-year-old?
In our model, a healthy 40-year-old man in the United States can expect to reach about 79.1 and a woman about 83.0. In the United Kingdom it is about 80.8 and 84.1. These are estimates for people with a healthy BMI who never smoked, and real lives spread widely around them.
Why does my result go up as I get older?
Because you have already lived through years of risk that some people your age did not survive. So the average for people who reach your age is a bit higher each year. In our model, a healthy US man’s expected age rises from about 79.1 at 40 to about 85.3 at 70.
Can a life expectancy calculator tell me when I will die?
No. It shows averages and ranges for groups of people with answers like yours. For a young adult, half of such a group dies within a window about 20 years wide. Use the result for planning and curiosity, not as a prediction. The death anxiety help page may help if it worries you.
Prefer an age or a date? Try what age will I die or the death date calculator.
Data: United Nations, World Population Prospects 2024. Method: how we calculate.
See your own estimate in 30 seconds
Free, private and based on UN 2024 data for 201 countries. Nothing you enter is stored.
Open the death clock →