
How Our Death Clock Calculates Your Estimate
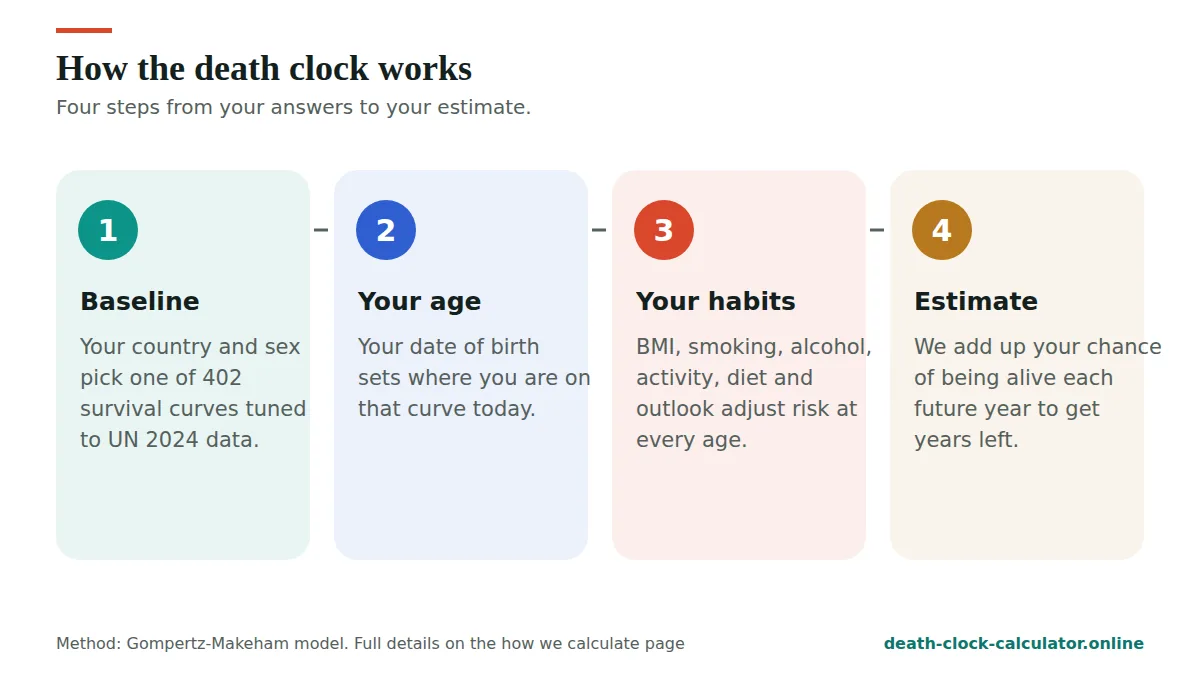
Here is how we calculate every estimate. Our death clock uses the Gompertz-Makeham survival model. We tune it so each country and sex matches its life expectancy at birth from UN World Population Prospects 2024. It starts from your current age, adjusts risk for your answers using published hazard ratios, and adds up your chance of being alive in every future year. Everything below is public so you can check it.
- UN 2024 data, 201 countries
- Nothing stored or sent
- Free, no sign-up
On this page
How we calculate: the formula
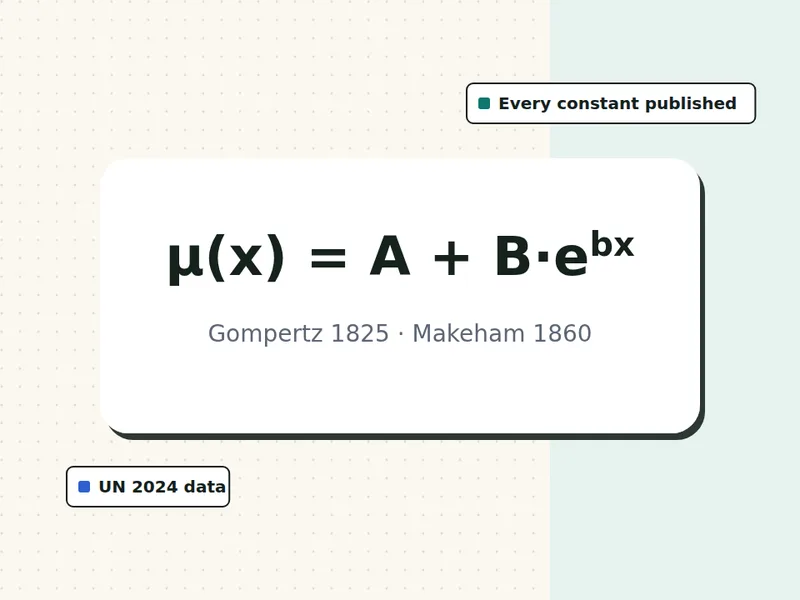
The model describes the risk of dying at age x, called the force of mortality, as:
μ(x) = A + m · B · eb·x
- A is a small, steady background risk that doesn’t change with age (accidents, some infections).
- B · eb·x is the risk that grows with age. It doubles every fixed number of years.
- m is your personal multiplier from BMI and the optional answers. With no extra risks, m = 1.
From this, the chance of still being alive at age x is:
S(x) = exp( −A·x − m·(B/b)·(eb·x − 1) )
The constants we use, and why
| Constant | Value | Why |
|---|---|---|
| b, rate of ageing | Fitted for each country and sex | We choose b so the curve also matches the UN’s life expectancy at age 65. This makes estimates for older people much closer to official figures. The fitted doubling times come out at about 6 to 9 years in most high-income countries, in line with published studies, and longer where many deaths happen at younger ages. |
| A, background risk (men) | 0.0004 per year | A small, steady risk that does not rise with age, such as accidents. With this value the fitted curves match UN figures at birth and at 65 for every country. |
| A, background risk (women) | 0.0002 per year | Half the men’s value, reflecting lower injury deaths. |
| B, level of risk | Solved for each country and sex | Found by bisection so the curve’s life expectancy at birth equals the UN figure to within 0.01 years, for the fitted b. |
| Country | B, men | B, women |
|---|---|---|
| United States | 8.807e-5 | 3.560e-5 |
| India | 1.793e-4 | 1.251e-4 |
| Pakistan | 4.129e-4 | 2.381e-4 |
| United Kingdom | 2.050e-5 | 1.129e-5 |
Step by step
- Baseline. Your country and sex select a UN life expectancy at birth. We solve B so the curve matches it.
- Your age. Your date of birth gives your exact age today, x.
- Your multiplier. BMI and optional answers are combined into m: the BMI hazard ratio times eb × effective-age years. We cap the total multiplier between 0.3 and 12.
- Remaining years. We add up S(x + t) ÷ S(x) for every future step t of 0.05 years, up to age 125, with the trapezoid rule. This is your remaining life expectancy, given that you have reached age x.
- Estimate. Age at death = x + remaining years. The projected date is today plus the remaining years.
- Middle half. The ages at which your conditional survival falls to 75% and 25%.
- What moves your estimate. We re-run steps 3 to 5 with one answer changed at a time, and then with the changes you pick together.
How each answer changes risk
BMI uses published hazard ratios. The other habits are entered as effective age: a number of years your risk behaves as if you were older (plus) or younger (minus). We turn that into a hazard multiplier with the fitted ageing rate, m = eb × years, so a habit is worth about the same number of years in every country.
| Input | Values used | Basis |
|---|---|---|
| BMI (hazard ratio) | Under 18.5: 1.51 · 18.5 to 19.9: 1.13 · 20 to 24.9: 1.00 · 25 to 27.4: 1.07 · 27.5 to 29.9: 1.20 · 30 to 34.9: 1.45 · 35 to 39.9: 1.94 · 40+: 2.76 | Hazard ratios as published by the Global BMI Mortality Collaboration (Lancet, 2016) |
| Smoking now (years) | Under 10 years smoked: +4 · 10 to 19: +6.5 · 20 to 29: +8.5 · 30+: +10.6 | Calibrated so lifelong smoking costs about 10 years, as in Doll and Peto (BMJ, 2004) |
| Former smoker | Share of the smoking effect that remains: quit by 30: 0% · 40: 5% · 50: 36% · 60: 62% · 70: 85% (straight lines in between) | Calibrated to the years won back by quitting at 30, 40, 50 and 60 in Doll and Peto |
| Alcohol (years) | Never or rarely: 0 · 2 to 4 times a month: +0.3 · 2 to 3 times a week: +0.8 · most days: +2.5 · several a day: +5 | Our weights. Direction and shape from GBD 2016 Alcohol Collaborators (Lancet, 2018) |
| Activity (years) | Mostly sitting: +2.2 · some: +0.7 · WHO target: −1.0 · above target: −2.2 | Our weights: least to most active is about 4.4 years, close to Moore and colleagues (PLOS Medicine, 2012) |
| Diet (years) | Processed: +1.8 · typical Western: +0.6 · balanced: 0 · Mediterranean: −1.2 · whole food and plants: −1.4 | Our weights, kept well below the gains modelled by Fadnes and colleagues (PLOS Medicine, 2022), with direction from PREDIMED (NEJM, 2018) |
| Outlook (years) | Very hopeful: −1.0 · mostly positive: −0.4 · in between: 0 · often down or worried: +1.0 | Our weights, small on purpose. Direction from Lee and colleagues (PNAS, 2019) and Alimujiang and colleagues (JAMA Network Open, 2019) |
Where a study reports a hazard ratio, we use it directly and let the survival curve turn it into years. Where it reports only a direction, we use small, cautious weights and say so here. Adding the effects assumes they are independent. In real life, risks overlap, so a long list of changes is an approximation.
The data
Every country uses two figures for men and two for women from the UN World Population Prospects 2024: life expectancy at birth and at age 65, from the medium variant, estimates for 2023. We include all 201 countries and territories with at least 90,000 people. One release and one year for every country keeps the comparison fair. The full table is on life expectancy by country.
Cause-of-death shares on how will I die come from the WHO Global Health Estimates 2021. The world death clock uses the UN’s 2026 projection of world deaths and births.
How we calculate and test the model
- For 12 checks (6 countries, both sexes, including the United States, India, Pakistan, Nigeria, Japan and Hong Kong), the curve returns the UN life expectancy at birth within 0.01 years. Our pass mark is 0.1 years.
- Life expectancy at 65 matches the UN figure within 0.1 years for all 402 country and sex groups, for example 18.7 years for US men and 21.3 for UK women.
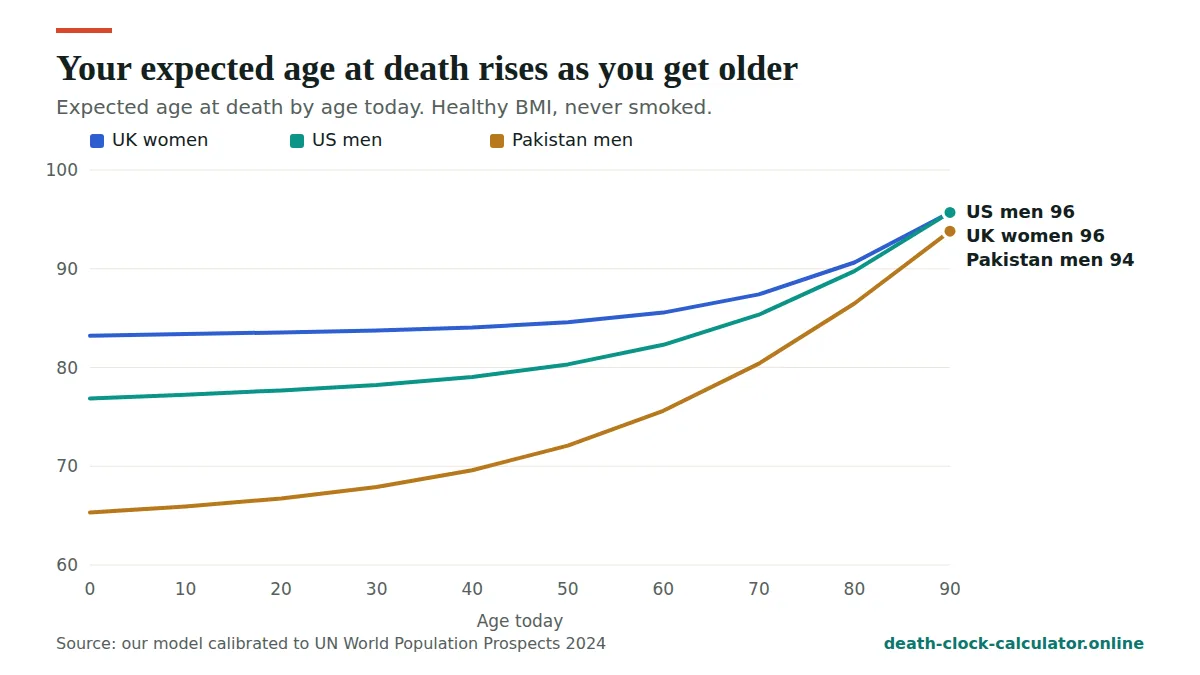
- For a fixed person, the expected age at death rises at every older attained age, as it should.
- The smoking settings reproduce years lost and years won back within about 0.6 years of Doll and Peto (10.0, 9.5, 6.4 and 3.6 years for quitting at 30, 40, 50 and 60).
Known limits
- The model sees an average person of your age, sex and country. It can’t see genes, illness, income or luck.
- Gompertz-Makeham has no special term for infant deaths. In countries with high child mortality, the curve can look slightly pessimistic for healthy adults.
- Survival to extreme ages, such as 100, is uncertain in any model. Treat those odds as rough.
- Lifestyle effects are multiplied as if independent. Real risks overlap.
- Death rates are from today. Future medical progress is not included, which likely makes estimates for young people too low.
- National averages hide large gaps by income and region.
Privacy
All maths runs in your browser. Your answers are never sent to our server, never stored, and never included in analytics. See our privacy policy.
How we calculate your estimate, in plain words
The formula above can look hard, so here is the same idea without the maths. Picture a large group of people who share your age, sex and country. Each year, a small share of that group dies. That share is tiny at 30, larger at 60 and much larger at 90. Our model follows the group year by year until almost nobody is left. That is how we calculate every result on the site.
Your estimate is the average age that group reaches. That is really all we calculate. The formula only decides how quickly the yearly risk grows, and the UN figures decide where the curve sits for your country.
Put simply, how we calculate comes down to three questions:
- Where does the curve start? The UN life expectancy for your country and sex sets the overall level.
- How fast does risk grow with age? The UN figure at 65 sets the steepness.
- How do your answers move it? Your BMI and habits make the yearly risk a little higher or lower for the whole group.
How we calculate: a worked example
Here is how we calculate one real result from start to finish. Take a 40-year-old man in the United States with a healthy BMI who has never smoked and skips the optional questions.
- Baseline. The UN figure for US men at birth is 76.86 years (2023 estimate). The model solves B so the curve matches it. For US men, B comes out at 8.807e-5 per year.
- Steepness. The ageing rate is fitted so the curve also gives 18.67 years at age 65, the UN figure. For US men, risk doubles about every 8.7 years.
- Multiplier. A healthy BMI has a hazard ratio of 1.00 and there are no other answers, so m = 1.
- Years left. The model adds up the chance of being alive in every small step after age 40. The total is 39.1 years.
- Estimate. 40 plus 39.1 gives an expected age at death of about 79.1.
The same person has about a 23% chance of reaching 90 in our model. These are estimates for a group of healthy non-smokers, not a forecast for one man. You can repeat the example yourself on the death clock calculator and see how we calculate each step.
How we calculate the middle half and planning ages
An average hides a wide spread. How we calculate that spread matters as much as the average itself. So next to the single estimate, we show the middle half: the ages by which a quarter and three quarters of people like you have died. Half of the group dies inside that window.
| Age today | Estimated age at death | Middle half (25% to 75%) | Width |
|---|---|---|---|
| 25 | 78 | 69 to 89 | 20 years |
| 45 | 80 | 71 to 90 | 19 years |
| 65 | 84 | 76 to 91 | 15 years |
| 85 | 93 | 88 to 96 | 8 years |
This is how we calculate the window: we find the age where conditional survival falls to 75%, then the age where it falls to 25%. For a young adult the window is about 20 years wide. That width is the honest answer to “how accurate is it?” for one person.
The life expectancy calculator uses the same curve for planning. It shows the ages that half, a quarter and a tenth of people like you live past.
How we calculate your chance of reaching 90 or 100
The same survival curve also gives the odds of reaching a given age. We take the share of the group still alive at that age and divide it by the share alive at your age today. That is how we calculate the percentages shown next to your result.
| Group | Reach 70 | Reach 80 | Reach 90 | Reach 100 |
|---|---|---|---|---|
| United States, men | 76% | 52% | 23% | 4% |
| United States, women | 84% | 64% | 34% | 7% |
| United Kingdom, men | 82% | 59% | 24% | 2% |
| United Kingdom, women | 87% | 68% | 35% | 6% |
| India, men | 63% | 35% | 10% | 1% |
| Pakistan, women | 61% | 34% | 10% | 1% |
Odds at 100 are the least certain part of any model, so treat them as rough. Very few people reach that age, and the data at the top end is thin.
How we calculate the effect of your age
Your estimate is always higher than the life expectancy at birth for your country, and it rises as you get older. This is survivorship. Once you have lived through the risks of childhood and early adult life, they no longer count against you.
| Age today | Years remaining | Expected age at death | Above the at-birth figure |
|---|---|---|---|
| 20 | 63.6 | 83.6 | +0.3 |
| 40 | 44.1 | 84.1 | +0.8 |
| 60 | 25.6 | 85.6 | +2.3 |
| 80 | 10.6 | 90.6 | +7.4 |
This is why we calculate from your exact age and never just subtract your age from the national average. That shortcut would give an 80-year-old woman in the UK about 3 years left. The model gives about 10.6. More ages and countries are on life expectancy by age.
How we calculate for different countries
Every country and sex gets its own curve, and how we calculate each one is the same. We do not copy one country’s shape onto another. The fitted ageing rate differs, and that changes how risk builds up over a lifetime.
| Group | UN years left at 65 | Risk doubles every |
|---|---|---|
| Hong Kong, women | 25.21 | 6.3 years |
| Japan, women | 24.85 | 6.3 years |
| United Kingdom, women | 21.34 | 6.8 years |
| United States, men | 18.67 | 8.7 years |
| Nigeria, men | 11.99 | 14.7 years |
A short doubling time means risk stays low for many years and then rises steeply late in life. A long doubling time, as for men in Nigeria, means more deaths happen at younger adult ages. Matching both the at-birth figure and the figure at 65 is how we calculate curves that fit older adults well in every country.
How we calculate the effect of habits
How we calculate habits is often misunderstood. We never add or subtract a fixed number of years for a habit. Instead, each answer changes the yearly risk, and the curve turns that into years. This means the same habit is worth a little less for someone already old, which matches what the studies found.
How we calculate BMI changes
How we calculate BMI is direct. It uses the published hazard ratios in the table above. For a 40-year-old in the United Kingdom who never smoked, a BMI of 35 to 39.9 lowers the estimate by about 6.3 years for men and 6.2 for women. A BMI of 40 or more lowers it by about 9.6 and 9.5 years. See BMI and life expectancy for every band.
How we calculate smoking and quitting
How we calculate smoking follows the same idea. Smoking for life costs about 10 years in the model. Quitting wins most of that back if it happens early. For UK men who smoked for 30 years or more, quitting at 30 gains about 10.1 years, at 50 about 5.8 years and at 70 about 0.8 years. The full table is on smoking and life expectancy.
How we calculate the optional answers
How we calculate the optional answers is deliberately cautious. Alcohol, activity, diet and outlook use small weights, listed in the table above. “Prefer not to say” always leaves the estimate unchanged. We chose small weights on purpose, because these studies report direction more reliably than exact size.
How we calculate dates and the countdown
How we calculate the date is the simplest part. The projected date is easy once the years are known. We take today’s date and add your remaining years. The countdown then shows the time between now and that date in days, hours, minutes and seconds.
For example, a healthy 30-year-old man in the United States has about 48.2 years left in our model. That is about 17,619 days. It is still an average for a group, and half of that group lives past it.
What we leave out on purpose
Some things people expect in a death clock have no place in an honest model. Here is what we do not use:
- Your name, star sign or birth chart. None of these affect health risk.
- Guesses about illness. We don’t ask about specific diseases, because a short quiz can’t judge them fairly. A doctor can.
- Future medical progress. We use today’s death rates, which likely makes estimates for younger people too low.
- Anything stored about you. The maths runs in your browser and nothing is saved.
If a result worries you, remember it describes a group average with a window of up to 20 years. Our death anxiety help page has calm, practical steps.
How we calculate updates and fix mistakes
The data and constants on this page are fixed for each release. When the UN publishes a new edition, we plan to refit every curve and log the change below. If you find a figure that looks wrong, the editorial policy explains how we check and correct it. This keeps how we calculate open and easy to test, which is the point of publishing it all here.
Why we publish how we calculate
A number about lifespan can feel heavy, so you should be able to see where it comes from. That is why we publish how we calculate in full, with the constants, the data year and the limits.
- You can check it. Anyone with a spreadsheet can rebuild the curve from the formula and the UN figures.
- You can see what it ignores. The limits above are part of the answer, not small print.
- You can compare. The same method runs for all 201 countries and territories, so results can be compared fairly on life expectancy by country.
If you only remember one thing about how we calculate, remember this: the result is an average for a large group of people like you, with a wide window around it. It is a guide for planning and curiosity, not a prediction about you.
Sources
- United Nations, DESA, Population Division. World Population Prospects 2024. population.un.org/wpp
- World Health Organization. Global Health Estimates 2021. who.int
- Gompertz B. Philosophical Transactions of the Royal Society, 1825; 115: 513-583.
- Makeham WM. Journal of the Institute of Actuaries, 1860; 8: 301-310.
- Global BMI Mortality Collaboration. The Lancet, 2016; 388: 776-786. doi
- Doll R, Peto R, et al. BMJ, 2004; 328: 1519. doi
- GBD 2016 Alcohol Collaborators. The Lancet, 2018; 392: 1015-1035. doi
- Moore SC, et al. PLOS Medicine, 2012; 9(11): e1001335. doi
- Estruch R, et al. NEJM, 2018; 378: e34. doi
- Fadnes LT, et al. PLOS Medicine, 2022; 19(2): e1003889. doi
- Lee LO, et al. PNAS, 2019; 116(37): 18357-18362. doi
- Alimujiang A, et al. JAMA Network Open, 2019; 2(5): e194270. doi
Change log
- September 2026: Launch. UN World Population Prospects 2024 (2023 estimates) for 201 countries and territories. WHO Global Health Estimates 2021 for causes of death. Ageing rate fitted to UN life expectancy at birth and at 65 for every country and sex.
Every change to how we calculate is logged here. Found a mistake? Tell us through our contact page. We check every report. Back to the death clock calculator.
See your own estimate in 30 seconds
Free, private and based on UN 2024 data for 201 countries. Nothing you enter is stored.
Open the death clock →