
Life Expectancy in The United States
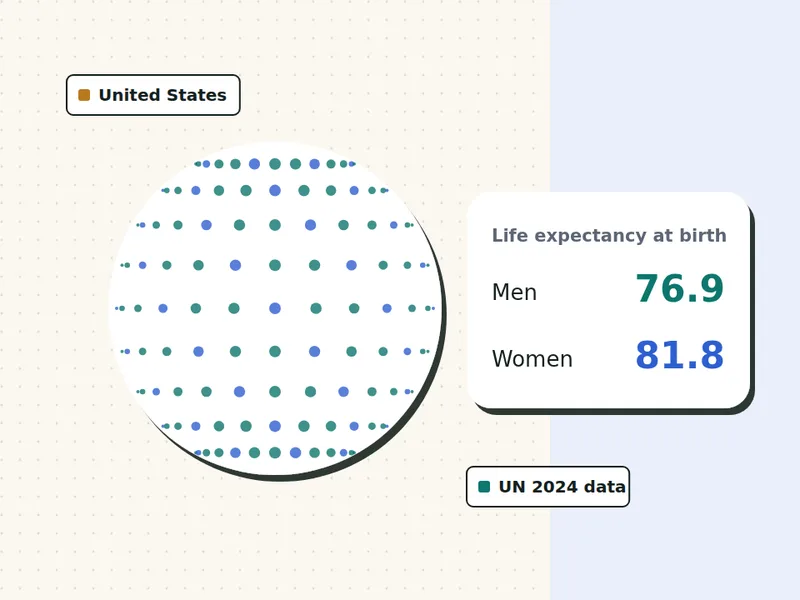
Life expectancy in the United States is about 76.9 years for men and 81.8 years for women at birth, according to UN World Population Prospects 2024 (2023 estimates). Adults can expect to live longer than that: a healthy 40-year-old man in the United States has an expected age at death of about 79.1, and a woman about 83.0. Use the calculator for your own estimate.
UN World Population Prospects 2024, 2023 estimates
- UN 2024 data, 201 countries
- Nothing stored or sent
- Free, no sign-up
On this page
What is the life expectancy in the United States?
At birth, life expectancy in the United States is 76.9 years for men and 81.8 years for women, a gap of 5.0 years. Among the 201 countries and territories in the UN data, that ranks the United States number 49 for men and 50 for women. These are period figures: how long a baby would live if today’s death rates never changed.
The United States spends more on health care than any other country, yet its life expectancy is lower than in most other high-income countries. Researchers point to higher rates of obesity, drug overdoses, road deaths and gun deaths, and big gaps in life expectancy by income and region.
What do official statistics in the United States say?
The National Center for Health Statistics (NCHS) reported life expectancy at birth of 79.0 years in 2024: 76.5 years for men and 81.4 for women, up 0.6 years from 2023. Heart disease, cancer and unintentional injuries were the top three causes of death.
Source: NCHS Data Brief No. 548, Mortality in the United States, 2024.
National offices often publish newer years or use different methods, so their figures can differ a little from the UN’s. We use the UN figures on our calculator so every country is measured the same way. Read more on data and sources.
Life expectancy by age in the United States
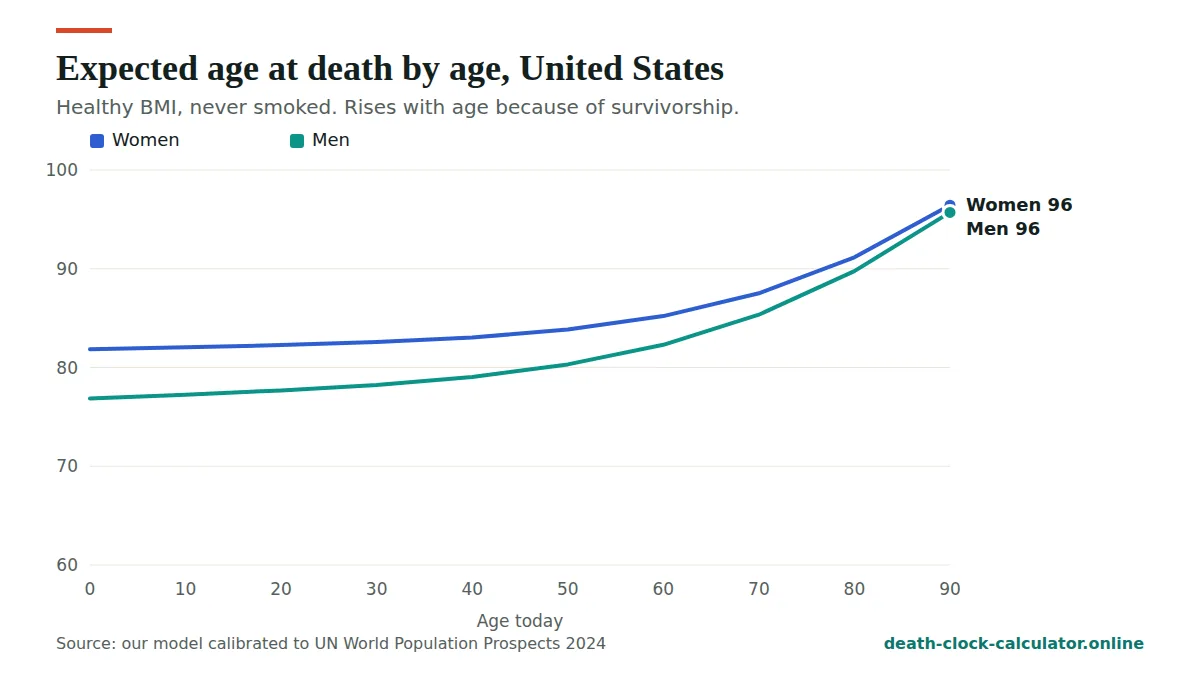
Your life expectancy rises as you get older, because you have already survived the years that pull the average down. The chart and table show our model for healthy non-smokers in the United States.
| Age today | Men: years left | Men: expected age at death | Women: years left | Women: expected age at death |
|---|---|---|---|---|
| 0 | 76.9 | 76.9 | 81.8 | 81.8 |
| 10 | 67.2 | 77.2 | 72.0 | 82.0 |
| 20 | 57.7 | 77.7 | 62.3 | 82.3 |
| 30 | 48.2 | 78.2 | 52.6 | 82.6 |
| 40 | 39.1 | 79.1 | 43.0 | 83.0 |
| 50 | 30.3 | 80.3 | 33.8 | 83.8 |
| 60 | 22.3 | 82.3 | 25.2 | 85.2 |
| 70 | 15.3 | 85.3 | 17.5 | 87.5 |
| 80 | 9.8 | 89.8 | 11.2 | 91.2 |
| 90 | 5.7 | 95.7 | 6.4 | 96.4 |
At 65, a healthy man in the United States can expect about 18.7 more years and a woman about 21.2, in our model.
What are the chances of living to 90 in the United States?
For a healthy 40-year-old who has never smoked, our model gives about a 23% chance of reaching 90 for men and 34% for women. Here are the odds for other ages:
| Group | Reach 70 | Reach 80 | Reach 90 | Reach 100 |
|---|---|---|---|---|
| Men | 76% | 52% | 23% | 4% |
| Women | 84% | 64% | 34% | 7% |
What age will people born in the United States live to?
This table shows the expected age at death and the projected year of death for people born in different years, calculated in September 2026 with today’s death rates. People born recently will probably live longer than shown, as health keeps improving.
| Born in | Men: age | Men: year | Women: age | Women: year |
|---|---|---|---|---|
| 1950 | 88 | 2038 | 90 | 2040 |
| 1960 | 84 | 2044 | 87 | 2047 |
| 1970 | 81 | 2051 | 85 | 2055 |
| 1980 | 80 | 2060 | 83 | 2063 |
| 1990 | 79 | 2069 | 83 | 2073 |
| 2000 | 78 | 2078 | 82 | 2082 |
| 2010 | 78 | 2088 | 82 | 2092 |
What are the leading causes of death in the United States?
| Group | Leading causes |
|---|---|
| Men 50 to 69 | Heart disease 16.4%, COVID-19 15.5%, lung cancer 4.9% |
| Men 70 and over | Heart disease 17.9%, COVID-19 12.5%, dementias 8.5% |
| Women 50 to 69 | COVID-19 15.7%, heart disease 10.3%, lung cancer 6.3% |
| Women 70 and over | Dementias 16.3%, heart disease 14.9%, COVID-19 9.8% |
2021 was a pandemic year, so COVID-19 ranks higher than it does now. For every age group and country, use our causes of death tool.
What would add the most years in the United States?
For Americans, the biggest gains usually come from not smoking, keeping a healthy weight and staying active. Deaths from drug use and injuries hit young and middle-aged adults hardest, so safety matters too.
Run the calculator above and open “What moves your estimate” to see how many years each change is worth for you. Our guide to how to live longer has the evidence for each habit.
How life expectancy in the United States compares with other rich countries
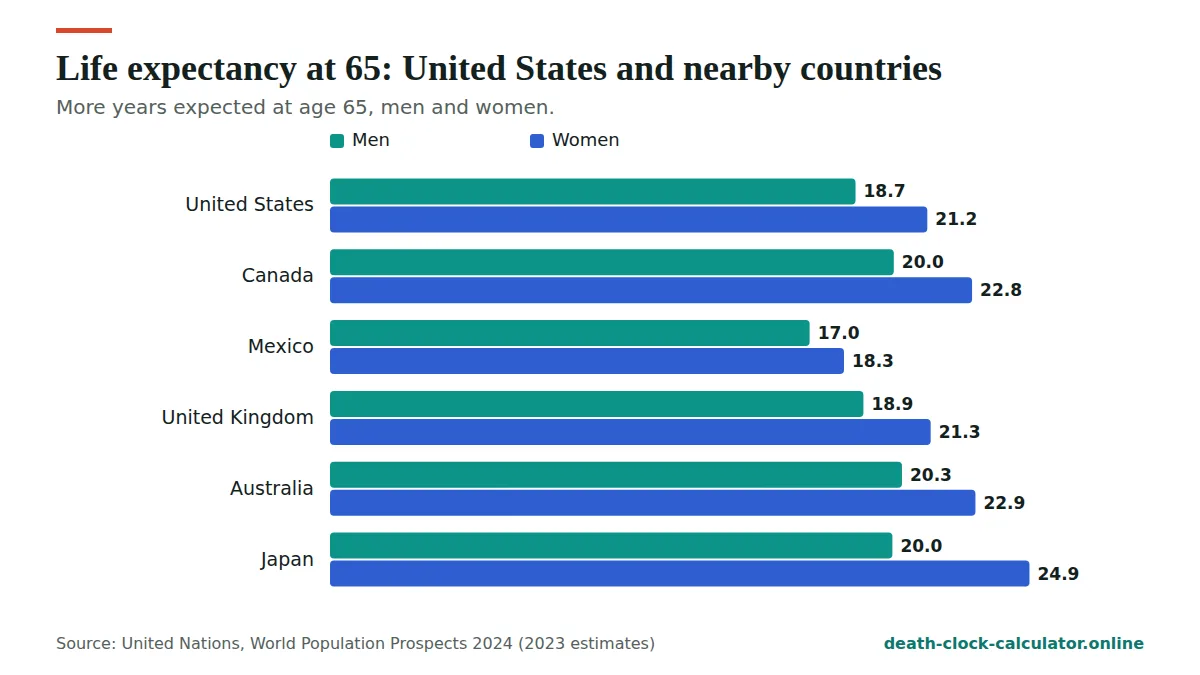
The table below puts life expectancy in the United States next to its two neighbours and six other high-income countries. It shows life expectancy at birth and the extra years a person can expect once they reach 65. All figures are from UN World Population Prospects 2024 (2023 estimates).
| Country | Men at birth | Women at birth | Men at 65 | Women at 65 |
|---|---|---|---|---|
| United States | 76.9 | 81.8 | 18.7 | 21.2 |
| Canada | 80.4 | 84.8 | 20.0 | 22.8 |
| Mexico | 72.2 | 77.8 | 17.0 | 18.3 |
| United Kingdom | 79.4 | 83.2 | 19.0 | 21.3 |
| Germany | 79.0 | 83.8 | 18.2 | 21.3 |
| France | 80.4 | 86.1 | 20.0 | 23.8 |
| Japan | 81.7 | 87.7 | 20.0 | 24.9 |
| Australia | 82.1 | 85.7 | 20.3 | 22.9 |
| South Korea | 81.2 | 87.2 | 18.6 | 23.6 |
At birth, US life expectancy trails every country in the table except Mexico. American men can expect about 3.6 fewer years than Canadian men, and American women about 3.0 fewer years than Canadian women. Japanese women can expect about 5.9 years more than American women.
The US life expectancy gap shrinks after 65
Look at the two columns on the right and the picture changes. At 65, US life expectancy for a man is 18.7 more years, only 1.4 fewer than a Canadian man and about the same as a British or South Korean man. An American man at 65 can even expect a little more time than a German man.
We worked out the average of the seven other high-income countries in the table (Mexico left out). At birth, US life expectancy is about 3.7 years below that average for men and 3.7 years below for women. At 65 the gap is only 0.8 years for men and 1.7 years for women.
The same pattern shows up when you rank US life expectancy against the rest of the world. The United States is number 49 of 201 for men at birth, but about number 32 for years left at 65. For women it moves from 50 to about 41. All of these are our own calculations from the UN data.
What does this tell you about life expectancy in the United States? Most of the shortfall comes from deaths before 65, not after. That fits the causes already named on this page: drug overdoses, road deaths and gun deaths mostly affect younger and middle-aged adults. Once Americans reach retirement age, US life expectancy is close to that of other rich countries.
What the NCHS figure of 79.0 years means
The National Center for Health Statistics figure quoted above, 79.0 years for 2024, is for everyone together. Men and women are also given separately: 76.5 years for men and 81.4 for women. The UN figures on this page, 76.9 and 81.8, are for 2023.
So the two sources put US life expectancy less than half a year apart for each sex. The small difference comes from the year covered, the population data used and the way each office smooths its numbers. Neither is wrong. The NCHS figure is the best guide to how life expectancy in the United States changes from year to year. The UN figure is better for comparing the United States with other countries, which is why our calculator uses it.
Keep in mind what both numbers are. They describe babies born in one year under that year’s death rates. They are not a forecast for any adult reading this page. If you want to know how the figures are built, our life expectancy glossary explains period life expectancy in plain words.
Average life expectancy in the US at every adult age
The table on this page shows life expectancy in the United States every ten years. Here are the ages in between, from the same model. They are estimates for people with a healthy BMI who have never smoked, so they sit a little above the average life expectancy in the US for everyone of that age.
| Age today | Men: years left | Men: expected age | Women: years left | Women: expected age |
|---|---|---|---|---|
| 25 | 52.9 | 77.9 | 57.4 | 82.4 |
| 35 | 43.6 | 78.6 | 47.8 | 82.8 |
| 45 | 34.6 | 79.6 | 38.4 | 83.4 |
| 55 | 26.2 | 81.2 | 29.4 | 84.4 |
| 65 | 18.7 | 83.7 | 21.2 | 86.2 |
| 75 | 12.4 | 87.4 | 14.2 | 89.2 |
| 85 | 7.5 | 92.5 | 8.6 | 93.6 |
Notice how slowly the expected age moves in early adulthood. A healthy American man of 25 has an expected age of 77.9, and at 45 it is only 79.6. After 55 it climbs much faster, because each year you live past that point you have come through a period when more people die.
Why one number is never your number
Any average hides a very wide spread, and life expectancy in the United States is no exception. In our model, a healthy American man of 25 who never smoked has an expected age at death of about 78. The middle half of men like him die somewhere between 69 and 89, a range of 20 years. At 45 the middle half runs from 71 to 90. At 65 it runs from 76 to 91.
So the average life expectancy in the US is a starting point, not a date. Plenty of people live well past it and some die well before it. That is why our death clock calculator always shows a range next to its estimate. Our page on life expectancy by age explains why the range narrows as you get older.
Why the gap between men and women is wide in the United States
In US life expectancy at birth, women are about 5.0 years ahead of men. The average gap across the 201 countries in the UN data is 5.2 years, so the US sits close to the middle. It is wider than the gap in the United Kingdom (3.8 years) and Canada (4.4 years), but narrower than in France or Japan.
The gap in US life expectancy between the sexes shrinks with age. At 65, UN data give American women about 2.5 more years than men. In our model the gap between a healthy man and woman is 3.9 years at age 40 and only 1.4 years at 80. By 40, the chance of reaching 90 is about 23% for men and 34% for women.
Much of the extra risk for American men sits in the years before retirement, where injuries, overdoses and early heart disease are more common in men. A man who avoids those risks in his 30s, 40s and 50s closes a good part of the gap for himself.
What you can control about US life expectancy
You cannot change your age, your sex or the country you were born in. You can change quite a lot of what happens next, and your own chances can sit well above or below the average life expectancy in the US. These steps are general, well-established and cost little or nothing:
- Stay off tobacco and nicotine. If you smoke, stopping at any age helps. Our page on smoking and life expectancy shows how much.
- Know your blood pressure. Many pharmacies will check it for you. High blood pressure usually has no symptoms.
- Keep your weight in a healthy range and move most days. Walking counts.
- Drive safely. Wear a seat belt every time, keep your phone away and never drive after drinking or using drugs.
- Take medicines only as prescribed, never mix sedatives or opioids with alcohol, and store them where others cannot reach them.
- Keep up with checkups and cancer screening your doctor recommends for your age.
See a doctor soon if you have chest pain, sudden weakness, trouble speaking, or a change in your body that does not go away. For the evidence behind each habit, read how to live longer.
If reading about life expectancy in the United States leaves you feeling uneasy, that is a common reaction. Our page on death anxiety help has calm, practical ideas for when these thoughts get heavy.
Frequently asked questions
What is the average life expectancy in the United States?
According to UN World Population Prospects 2024, life expectancy at birth in the United States was about 76.9 years for men and 81.8 years for women in 2023. Adults who have already passed childhood and young adulthood can expect to live longer than these figures.
How long do men live in the United States?
Men in the United States have a life expectancy at birth of about 76.9 years. In our model, a healthy 40-year-old man who has never smoked has an expected age at death of about 79.1, and a 65-year-old man can expect about 18.7 more years.
How long do women live in the United States?
Women in the United States have a life expectancy at birth of about 81.8 years. In our model, a healthy 40-year-old woman has an expected age at death of about 83.0, and a 65-year-old woman can expect about 21.2 more years.
Why do women live longer than men in the United States?
Women in the United States live about 5.0 years longer at birth. In most countries, men smoke and drink more, die more often from injuries and heart disease at younger ages, and see doctors less. Some biological protection for women also plays a part.
How can I estimate my own life expectancy in the United States?
Use the calculator on this page. It starts from the UN figure for the United States, adjusts for your age and sex, and applies published effects of BMI, smoking, alcohol, activity, diet and outlook. Everything runs in your browser and nothing is stored.
Is US life expectancy lower than in other rich countries?
Yes, at birth. In UN World Population Prospects 2024 (2023 estimates), US life expectancy trails Canada, the United Kingdom, Germany, France, Japan, Australia and South Korea. At 65 the gap is much smaller: American men can expect 18.7 more years, close to British men. See life expectancy by country for every country.
How many years does a 50-year-old American have left?
US life expectancy at 50 is well above the at-birth figure. In our model, a healthy 50-year-old who has never smoked can expect about 30.3 more years for men and 33.8 for women. That puts the expected age at death at about 80.3 and 83.8. These are group averages with a wide range. Smoking or a high BMI lowers them.
Why is the NCHS figure different from the UN figure?
The NCHS reported 76.5 years for men and 81.4 for women in 2024. The UN gives 76.9 and 81.8 for 2023. They cover different years and use slightly different methods, so small differences are normal. We use the UN figures so life expectancy in the United States can be compared fairly with other countries.
What is the average life expectancy in the US for a 30-year-old?
In our model, a healthy 30-year-old American who has never smoked has an expected age at death of about 78.2 for men and 82.6 for women. That is higher than the at-birth figure because they have already lived through childhood and their 20s. Try the death clock calculator for your own estimate.
Compare the United States with every other country on life expectancy by country, or go back to the death clock calculator.
See your own estimate in 30 seconds
Free, private and based on UN 2024 data for 201 countries. Nothing you enter is stored.
Open the death clock →