
Life Expectancy in India
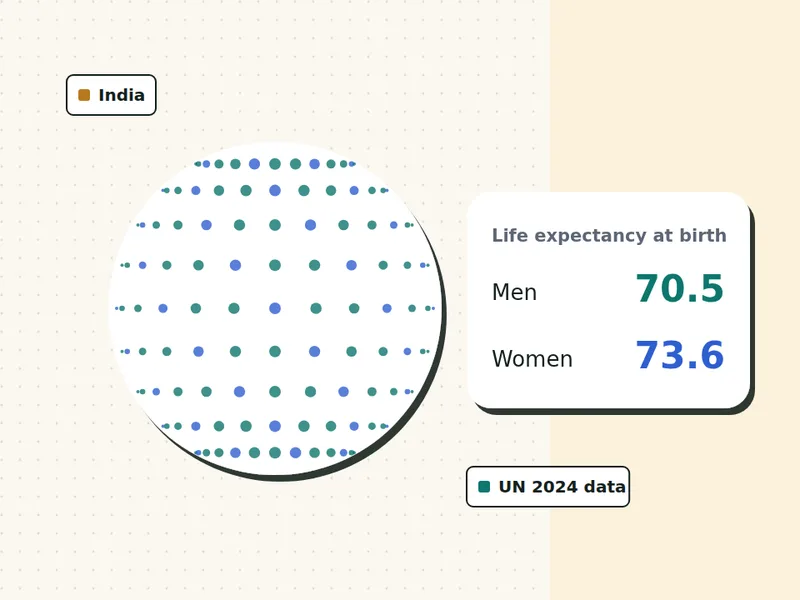
Life expectancy in India is about 70.5 years for men and 73.6 years for women at birth, according to UN World Population Prospects 2024 (2023 estimates). Adults can expect to live longer than that: a healthy 40-year-old man in India has an expected age at death of about 73.4, and a woman about 75.7. Use the calculator for your own estimate.
UN World Population Prospects 2024, 2023 estimates
- UN 2024 data, 201 countries
- Nothing stored or sent
- Free, no sign-up
On this page
What is the life expectancy in India?
At birth, life expectancy in India is 70.5 years for men and 73.6 years for women, a gap of 3.1 years. Among the 201 countries and territories in the UN data, that ranks India number 106 for men and 135 for women. These are period figures: how long a baby would live if today’s death rates never changed.
Life expectancy in India has risen strongly over the past few decades as child deaths, infections and extreme poverty have fallen. Heart disease, stroke and COPD are now leading causes of death in middle and older age. Life expectancy still varies a lot between states.
What do official statistics in India say?
India’s Sample Registration System (SRS), run by the Office of the Registrar General, publishes its own abridged life tables for the country and for major states. Its figures can differ from the UN’s because of the years covered and the methods used. We use the UN figure so India can be compared fairly with other countries.
Source: Office of the Registrar General, India: SRS abridged life tables.
National offices often publish newer years or use different methods, so their figures can differ a little from the UN’s. We use the UN figures on our calculator so every country is measured the same way. Read more on data and sources.
Life expectancy by age in India
Your life expectancy rises as you get older, because you have already survived the years that pull the average down. The chart and table show our model for healthy non-smokers in India.
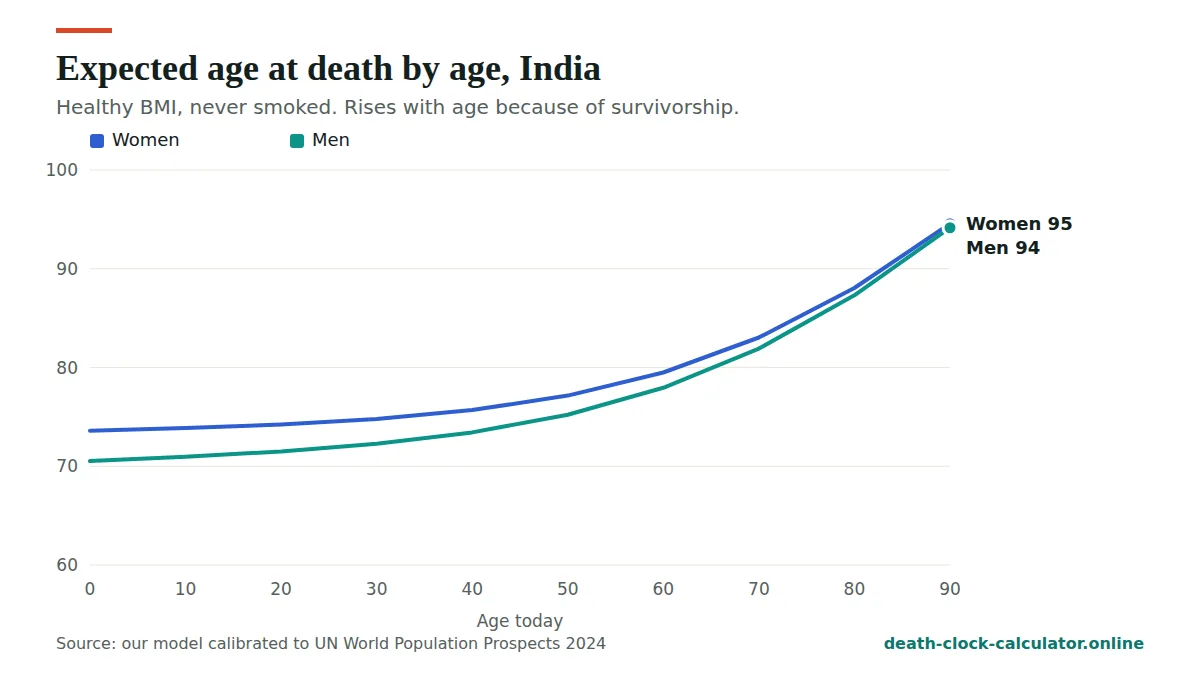
| Age today | Men: years left | Men: expected age at death | Women: years left | Women: expected age at death |
|---|---|---|---|---|
| 0 | 70.5 | 70.5 | 73.6 | 73.6 |
| 10 | 61.0 | 71.0 | 63.9 | 73.9 |
| 20 | 51.5 | 71.5 | 54.2 | 74.2 |
| 30 | 42.3 | 72.3 | 44.8 | 74.8 |
| 40 | 33.4 | 73.4 | 35.7 | 75.7 |
| 50 | 25.2 | 75.2 | 27.2 | 77.2 |
| 60 | 17.9 | 77.9 | 19.5 | 79.5 |
| 70 | 11.9 | 81.9 | 13.0 | 83.0 |
| 80 | 7.3 | 87.3 | 8.0 | 88.0 |
| 90 | 4.2 | 94.2 | 4.6 | 94.6 |
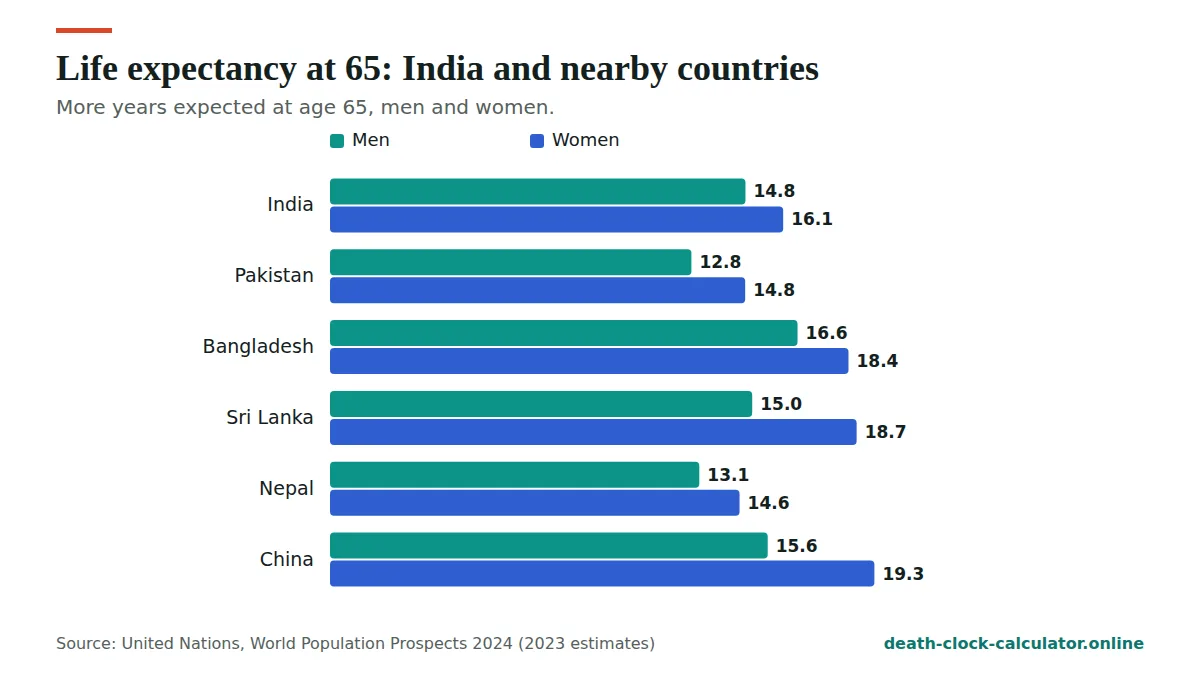
At 65, a healthy man in India can expect about 14.8 more years and a woman about 16.1, in our model.
What are the chances of living to 90 in India?
For a healthy 40-year-old who has never smoked, our model gives about a 10% chance of reaching 90 for men and 14% for women. Here are the odds for other ages:
| Group | Reach 70 | Reach 80 | Reach 90 | Reach 100 |
|---|---|---|---|---|
| Men | 63% | 35% | 10% | 1% |
| Women | 69% | 42% | 14% | 1% |
What age will people born in India live to?
This table shows the expected age at death and the projected year of death for people born in different years, calculated in September 2026 with today’s death rates. People born recently will probably live longer than shown, as health keeps improving.
| Born in | Men: age | Men: year | Women: age | Women: year |
|---|---|---|---|---|
| 1950 | 85 | 2035 | 86 | 2036 |
| 1960 | 80 | 2040 | 82 | 2042 |
| 1970 | 77 | 2047 | 78 | 2048 |
| 1980 | 74 | 2054 | 77 | 2057 |
| 1990 | 73 | 2063 | 75 | 2065 |
| 2000 | 72 | 2072 | 75 | 2075 |
| 2010 | 71 | 2081 | 74 | 2084 |
What are the leading causes of death in India?
| Group | Leading causes |
|---|---|
| Men 50 to 69 | COVID-19 29.7%, heart disease 15.3%, COPD 6.3% |
| Men 70 and over | COVID-19 32.3%, heart disease 13.0%, COPD 11.0% |
| Women 50 to 69 | COVID-19 17.5%, heart disease 14.0%, stroke 8.5% |
| Women 70 and over | COVID-19 21.1%, COPD 13.0%, heart disease 12.2% |
2021 was a pandemic year, so COVID-19 ranks higher than it does now. For every age group and country, use our causes of death tool.
What would add the most years in India?
For many Indians, the biggest gains come from avoiding tobacco in any form, checking blood pressure and blood sugar, and cutting exposure to smoke from cooking fuels and air pollution where possible. South Asians face higher diabetes and heart risk at lower BMIs, so the Asian BMI cut-offs are worth knowing.
Run the calculator above and open “What moves your estimate” to see how many years each change is worth for you. Our guide to how to live longer has the evidence for each habit.
Life expectancy in India compared with other Asian countries
How does life expectancy in India look next to its neighbours and to other large Asian countries? The table shows the UN figures at birth and at 65, plus the gap between women and men at birth. All figures are from UN World Population Prospects 2024 (2023 estimates).
| Country | Men at birth | Women at birth | Men at 65 | Women at 65 | Gap at birth |
|---|---|---|---|---|---|
| India | 70.5 | 73.6 | 14.8 | 16.1 | 3.1 |
| Bangladesh | 73.0 | 76.4 | 16.6 | 18.4 | 3.3 |
| Sri Lanka | 74.2 | 80.6 | 15.0 | 18.7 | 6.4 |
| Nepal | 68.8 | 71.8 | 13.1 | 14.6 | 3.0 |
| Bhutan | 71.3 | 75.0 | 13.8 | 15.9 | 3.7 |
| China | 75.2 | 80.9 | 15.6 | 19.3 | 5.7 |
| Indonesia | 69.0 | 73.3 | 13.1 | 15.6 | 4.2 |
| Vietnam | 69.9 | 79.3 | 14.7 | 19.4 | 9.4 |
| Thailand | 72.2 | 80.9 | 17.8 | 21.2 | 8.7 |
For men, life expectancy in India sits in the middle of this group. Indian men can expect about 2.5 fewer years than men in Bangladesh and 4.7 fewer than men in China, but a little more than men in Nepal, Indonesia and Vietnam.
For women, life expectancy in India looks weaker. Women in India can expect about 7.3 fewer years than women in China or Thailand, and about 7.0 fewer than women in Sri Lanka. Only Nepal and Indonesia are lower in the table. Differences are our own calculations from the UN data.
India and the world average
The UN world figures are 70.6 years for men and 75.9 for women at birth. So life expectancy in India for men is almost exactly the world figure, while for women it is about 2.3 years below it.
The world ranking of life expectancy in India tells the same story. Out of 201 countries and territories, India is number 106 for men but 135 for women. At 65 the ranks are about 97 for men and 132 for women, our own calculation from the UN data.
Why the gap between men and women is small in India
Across the 201 countries in the UN data, women live on average 5.2 years longer than men. In India the gap is only 3.1 years. Bangladesh (3.3) and Nepal (3.0) are much the same, so this is a South Asian pattern rather than something unique to one country.
The gap in life expectancy in India between the sexes shrinks further with age. At 65, UN data give Indian women about 1.3 more years than men. In our model, the gap between a healthy man and woman is 2.3 years at 40 and just 0.7 years at 80. For a healthy 40-year-old, the chance of reaching 90 is about 10% for men and 14% for women.
The numbers alone cannot explain the small gap. Reasons often discussed include:
- Women and girls in some families getting less or later medical care than men and boys.
- Risks linked to pregnancy and childbirth, which fall only on women.
- Smoke from cooking on wood, dung or coal, which women breathe for hours each day in many homes.
- Tobacco use, which is more common in men and pushes the other way.
Whatever the mix, it means that life expectancy in India for women has more room to rise than in countries where the gap is already wide.
Life expectancy in India by age, next to the world
The age table higher up shows life expectancy in India for healthy adults. Here is the same model at six ages, set next to the world figures. All are estimates for people with a healthy BMI who have never smoked.
| Age today | India men | World men | India women | World women |
|---|---|---|---|---|
| 30 | 42.3 | 42.7 | 44.8 | 47.4 |
| 40 | 33.4 | 34.1 | 35.7 | 38.4 |
| 50 | 25.2 | 26.2 | 27.2 | 30.0 |
| 60 | 17.9 | 19.1 | 19.5 | 22.4 |
| 70 | 11.9 | 13.2 | 13.0 | 15.8 |
| 80 | 7.3 | 8.6 | 8.0 | 10.5 |
At 30, life expectancy in India for a healthy man is almost the same as the world average. By 60 he is about 1.2 years behind. For women the shortfall is larger at every age, close to 3 years at 50 and 60.
So the difference in life expectancy in India is not only about childhood. It keeps building through middle and older age, when heart disease, stroke and COPD become the main causes of death. That is also where the most can be done, as the next sections show.
What a 60-year-old in India can expect
In our model of life expectancy in India, a healthy man of 60 has an expected age at death of about 77.9, and a woman about 79.5. That is 7.4 and 5.9 years above the figures at birth. For many families this matters more than the headline number: a parent who has reached 60 in good health has, on average, a good number of years ahead. As always, these are group averages with a wide range, not a forecast for one person. Our page on life expectancy by age explains why the range is wide.
How to use India’s SRS life tables
The Sample Registration System mentioned above publishes abridged life tables. “Abridged” means the table uses age groups (for example 5-year bands) rather than every single year of age. They are published for India as a whole and for the larger states.
This makes the SRS useful for studying life expectancy in India in a way the UN figure is not. Life expectancy in India differs a lot from state to state, so if you want a feel for your own region, the SRS table for your state is closer to local reality than any national average.
The SRS covers different years from the UN and uses its own methods, so do not expect the two to match exactly. Our calculator starts from the UN figure so that life expectancy in India can be set fairly against every other country. The data and sources page explains how we choose sources.
Everyday steps that improve life expectancy in India
You cannot change the national average for life expectancy in India, but a few simple habits can move your own odds well above it. None of these needs money or special equipment:
- Give up tobacco in every form. Cigarettes, bidis, gutka, khaini and paan with tobacco all raise the risk of cancer and heart disease. Our page on smoking and life expectancy shows what stopping is worth.
- Check blood pressure and blood sugar once a year from your 30s, even if you feel well. Many pharmacies and government health centres can do this.
- Watch your waist and weight. South Asians face higher heart and diabetes risk at a lower BMI, so use the Asian cut-offs. See what BMI means in the death clock.
- Reduce smoke at home. Use cleaner cooking fuel where you can, keep the kitchen ventilated and keep children away from the stove.
- Stay safe on the road. Wear a helmet on two-wheelers and a seat belt in cars, every time.
- Walk most days and cut back on sugar, fried food and salt.
See a doctor quickly for chest pain, sudden weakness on one side, trouble speaking, or breathlessness that is getting worse. Fast treatment for heart attack and stroke saves lives.
To see how these habits change your own estimate of life expectancy in India, use the death clock calculator at the top of this page. If these numbers leave you worried, our death anxiety help page has calm, practical ideas.
Frequently asked questions
What is the average life expectancy in India?
According to UN World Population Prospects 2024, life expectancy at birth in India was about 70.5 years for men and 73.6 years for women in 2023. Adults who have already passed childhood and young adulthood can expect to live longer than these figures.
How long do men live in India?
Men in India have a life expectancy at birth of about 70.5 years. In our model, a healthy 40-year-old man who has never smoked has an expected age at death of about 73.4, and a 65-year-old man can expect about 14.8 more years.
How long do women live in India?
Women in India have a life expectancy at birth of about 73.6 years. In our model, a healthy 40-year-old woman has an expected age at death of about 75.7, and a 65-year-old woman can expect about 16.1 more years.
Why do women live longer than men in India?
Women in India live about 3.1 years longer at birth. In most countries, men smoke and drink more, die more often from injuries and heart disease at younger ages, and see doctors less. Some biological protection for women also plays a part.
How can I estimate my own life expectancy in India?
Use the calculator on this page. It starts from the UN figure for India, adjusts for your age and sex, and applies published effects of BMI, smoking, alcohol, activity, diet and outlook. Everything runs in your browser and nothing is stored.
Is life expectancy in India higher than in Pakistan and Bangladesh?
Higher than Pakistan, lower than Bangladesh. In UN World Population Prospects 2024 (2023 estimates), life expectancy in India is 70.5 years for men and 73.6 for women. Pakistan is 65.3 and 70.2, and Bangladesh 73.0 and 76.4. See life expectancy in Pakistan for more.
Is life expectancy in India above the world average?
For men it is almost exactly the same: 70.5 years in India against 70.6 for the world. For women it is lower: 73.6 in India against 75.9 for the world. Indian women are ranked 135 of 201 countries, while Indian men are ranked 106 (UN 2024 data).
How long can a 60-year-old in India expect to live?
Life expectancy in India rises with age. In our model, a healthy 60-year-old who has never smoked can expect about 17.9 more years for a man and 19.5 for a woman. That gives an expected age at death of about 77.9 and 79.5. Many people live well beyond these group averages, and some do not reach them.
Why is the gap between men and women smaller in India?
Life expectancy in India is only 3.1 years higher for women than for men, against an average of 5.2 years across 201 countries. Neighbours like Bangladesh and Nepal show the same pattern. Reasons often discussed include unequal access to health care, risks in childbirth and smoke from cooking fuels.
Compare India with every other country on life expectancy by country, or go back to the death clock calculator.
See your own estimate in 30 seconds
Free, private and based on UN 2024 data for 201 countries. Nothing you enter is stored.
Open the death clock →