
Life Expectancy in Pakistan
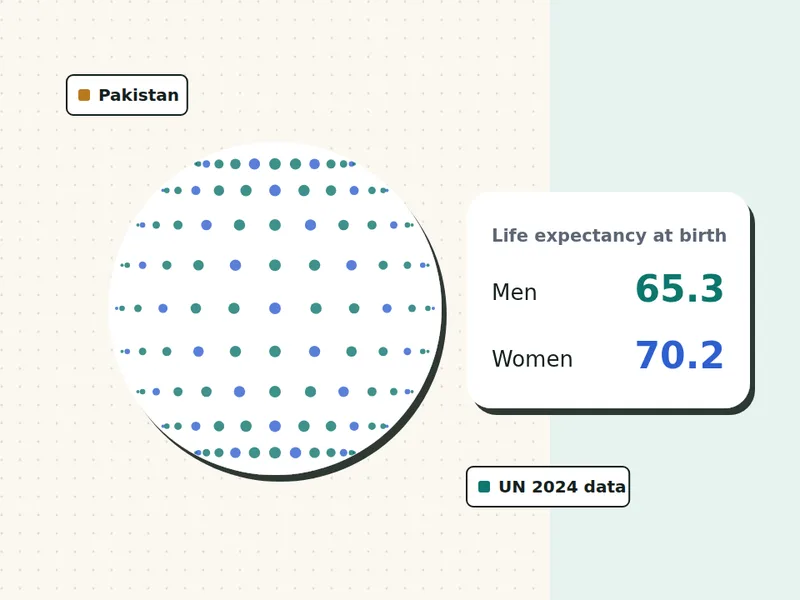
Life expectancy in Pakistan is about 65.3 years for men and 70.2 years for women at birth, according to UN World Population Prospects 2024 (2023 estimates). Adults can expect to live longer than that: a healthy 40-year-old man in Pakistan has an expected age at death of about 69.6, and a woman about 73.1. Use the calculator for your own estimate.
UN World Population Prospects 2024, 2023 estimates
- UN 2024 data, 201 countries
- Nothing stored or sent
- Free, no sign-up
On this page
What is the life expectancy in Pakistan?
At birth, life expectancy in Pakistan is 65.3 years for men and 70.2 years for women, a gap of 4.8 years. Among the 201 countries and territories in the UN data, that ranks Pakistan number 155 for men and 159 for women. These are period figures: how long a baby would live if today’s death rates never changed.
Life expectancy in Pakistan is lower than in most of its neighbours, mainly because of high infant and child mortality and a heavy burden of heart disease and stroke in adults. Many deaths in childhood pull the at-birth figure down, so adults who have passed childhood can expect to live noticeably longer than the headline number.
What do official statistics in Pakistan say?
Pakistan does not publish a regular national life table that we could verify, so we use the UN World Population Prospects 2024 figures, which draw on Pakistan’s census and survey data. When a verified national figure is available, we will add it here.
Source: United Nations, World Population Prospects 2024.
National offices often publish newer years or use different methods, so their figures can differ a little from the UN’s. We use the UN figures on our calculator so every country is measured the same way. Read more on data and sources.
Life expectancy by age in Pakistan
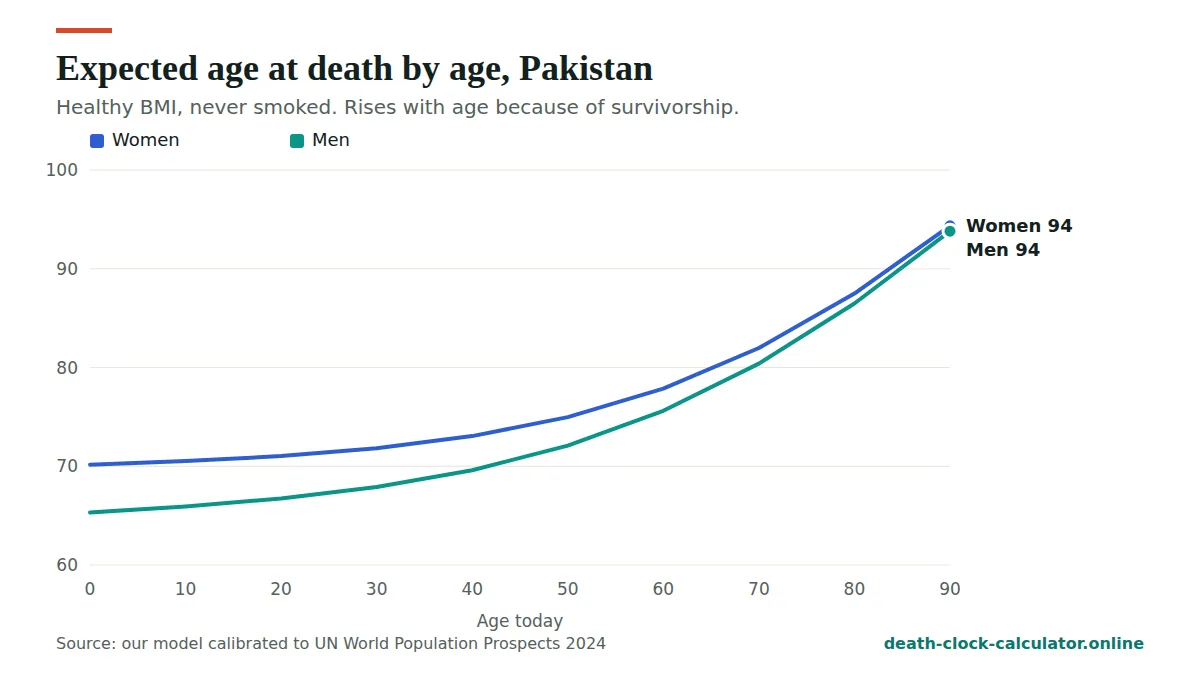
Your life expectancy rises as you get older, because you have already survived the years that pull the average down. The chart and table show our model for healthy non-smokers in Pakistan.
| Age today | Men: years left | Men: expected age at death | Women: years left | Women: expected age at death |
|---|---|---|---|---|
| 0 | 65.3 | 65.3 | 70.2 | 70.2 |
| 10 | 55.9 | 65.9 | 60.5 | 70.5 |
| 20 | 46.7 | 66.7 | 51.0 | 71.0 |
| 30 | 37.9 | 67.9 | 41.8 | 71.8 |
| 40 | 29.6 | 69.6 | 33.1 | 73.1 |
| 50 | 22.1 | 72.1 | 25.0 | 75.0 |
| 60 | 15.6 | 75.6 | 17.9 | 77.9 |
| 70 | 10.4 | 80.4 | 12.0 | 82.0 |
| 80 | 6.5 | 86.5 | 7.5 | 87.5 |
| 90 | 3.8 | 93.8 | 4.4 | 94.4 |
At 65, a healthy man in Pakistan can expect about 12.8 more years and a woman about 14.7, in our model.
What are the chances of living to 90 in Pakistan?
For a healthy 40-year-old who has never smoked, our model gives about a 5% chance of reaching 90 for men and 10% for women. Here are the odds for other ages:
| Group | Reach 70 | Reach 80 | Reach 90 | Reach 100 |
|---|---|---|---|---|
| Men | 51% | 24% | 5% | 0% |
| Women | 61% | 34% | 10% | 1% |
What age will people born in Pakistan live to?
This table shows the expected age at death and the projected year of death for people born in different years, calculated in September 2026 with today’s death rates. People born recently will probably live longer than shown, as health keeps improving.
| Born in | Men: age | Men: year | Women: age | Women: year |
|---|---|---|---|---|
| 1950 | 84 | 2034 | 85 | 2035 |
| 1960 | 78 | 2038 | 80 | 2040 |
| 1970 | 74 | 2044 | 77 | 2047 |
| 1980 | 71 | 2051 | 74 | 2054 |
| 1990 | 69 | 2059 | 73 | 2063 |
| 2000 | 67 | 2067 | 71 | 2071 |
| 2010 | 66 | 2076 | 71 | 2081 |
What are the leading causes of death in Pakistan?
| Group | Leading causes |
|---|---|
| Men 50 to 69 | Heart disease 21.0%, COVID-19 13.2%, stroke 9.3% |
| Men 70 and over | Heart disease 19.1%, COVID-19 13.3%, COPD 12.8% |
| Women 50 to 69 | Heart disease 19.5%, stroke 11.7%, COVID-19 9.4% |
| Women 70 and over | Heart disease 20.6%, stroke 13.3%, COVID-19 9.9% |
2021 was a pandemic year, so COVID-19 ranks higher than it does now. For every age group and country, use our causes of death tool.
What would add the most years in Pakistan?
In Pakistan, heart disease and stroke are the top causes of death from middle age. Checking blood pressure, avoiding tobacco (including naswar and chewing tobacco), staying active and watching weight with the Asian BMI cut-offs are some of the most useful steps.
Run the calculator above and open “What moves your estimate” to see how many years each change is worth for you. Our guide to how to live longer has the evidence for each habit.
Why the headline figure for life expectancy in Pakistan looks low
The at-birth number is an average over every baby born, including those who die in infancy or early childhood. When many deaths happen at very young ages, they pull the average down a long way. That is a big part of why life expectancy in Pakistan looks so much lower than in rich countries.
It does not mean most adults die in their mid-60s. Once you are an adult, the headline figure for life expectancy in Pakistan is a poor guide to your own future.
A better way to read life expectancy in Pakistan is to ask two questions. How long does a person who has already reached my age live, on average? And what can I still change? The sections below answer both.
Where the figures for life expectancy in Pakistan come from
We could not verify a regular national life table for Pakistan, so every national number on this page is from UN World Population Prospects 2024 (2023 estimates). The UN builds its estimates from census, survey and other data, then fills gaps with statistical models.
That makes the UN figure for life expectancy in Pakistan the best single estimate we can check, but not a measured count. Real life expectancy in Pakistan may be a little higher or lower than the UN says. It is also very likely to differ between provinces, between cities and villages, and between richer and poorer families. The UN gives one figure for the whole country, so read it as a national average, not a local one.
Our calculator starts from the same UN figure. You can see exactly how we turn it into a personal estimate on how we calculate.
How life expectancy in Pakistan compares with its neighbours
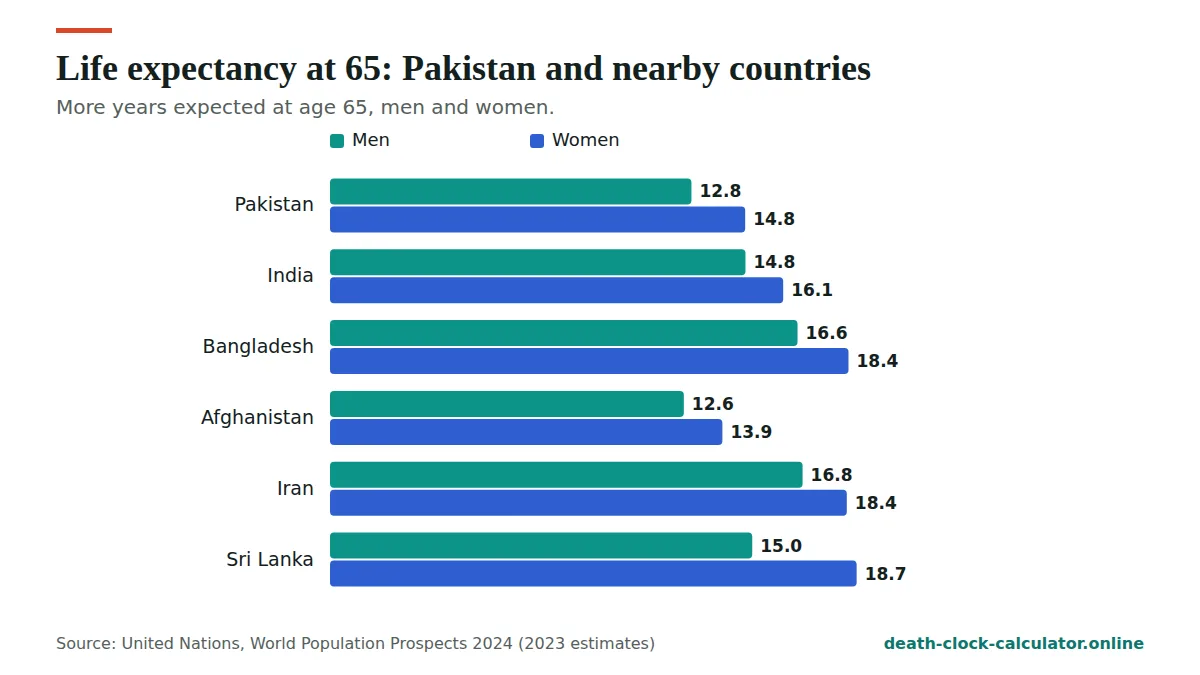
The table sets life expectancy in Pakistan beside nearby countries, at birth and at 65. The figure at 65 is useful because it leaves out deaths in childhood and young adulthood.
| Country | Men at birth | Women at birth | Men at 65 | Women at 65 |
|---|---|---|---|---|
| Pakistan | 65.3 | 70.2 | 12.8 | 14.8 |
| Afghanistan | 64.5 | 67.5 | 12.6 | 13.9 |
| India | 70.5 | 73.6 | 14.8 | 16.1 |
| Nepal | 68.8 | 71.8 | 13.1 | 14.6 |
| Bangladesh | 73.0 | 76.4 | 16.6 | 18.4 |
| Sri Lanka | 74.2 | 80.6 | 15.0 | 18.7 |
| China | 75.2 | 80.9 | 15.6 | 19.3 |
| Iran | 75.8 | 79.6 | 16.8 | 18.4 |
Averaged across the seven other countries in the table, men live about 6.4 years longer at birth than men in Pakistan, and women about 5.6 years longer. At 65 the distance shrinks to about 2.1 years for men and 2.3 years for women. These are simple averages we worked out from UN World Population Prospects 2024 (2023 estimates).
The pattern tells a clear story. Much of the gap in life expectancy in Pakistan comes from deaths before old age, not from how long older people live once they get there.
Life expectancy in Pakistan and India side by side
India is the closest large comparison. At birth, men in India live about 5.2 years longer than men in Pakistan and women about 3.4 years longer. At 65, the difference falls to about 1.9 years for men and 1.4 years for women. You can read the full picture on our page on life expectancy in India.
Bangladesh is further ahead still: about 7.7 years for men and 6.2 years for women at birth. That suggests life expectancy in Pakistan has room to rise.
Life expectancy in Pakistan against the world average
Take a simple average of all 201 countries and territories in the UN data, counting each place once whatever its size. Men average about 71.0 years at birth and women about 76.2. Life expectancy in Pakistan sits about 5.7 years below that for men and about 6.1 years below for women.
At 65 the distance is smaller: about 2.4 years for men and 3.2 years for women. Pakistan ranks 161st of 201 for men at 65 and 157th for women. We worked out these averages and ranks from UN World Population Prospects 2024 (2023 estimates). For every country in one place, see life expectancy by country.
Life expectancy in Pakistan for men and women
At birth, women in Pakistan live about 4.8 years longer than men. That is close to the middle of the range worldwide. The average gap across the 201 countries and territories in the UN data is 5.2 years, and Pakistan ranks 109th for the size of its gap.
At 65, the gap is much smaller. The UN puts the years left at 65 at about 14.8 for women and 12.8 for men, a difference of about 1.9 years. (Our model gives 14.7 for women at 65, a rounding difference.) The average gap at 65 across the 201 countries is about 2.7 years, so older men and women in Pakistan are closer together than in most places. We worked out both averages from UN World Population Prospects 2024 (2023 estimates).
Much of the difference between men and women in life expectancy in Pakistan builds up in the working years. Heart disease, stroke, tobacco use and injuries tend to hit men earlier.
What adults in Pakistan can expect at different ages
The age table on this page shows life expectancy in Pakistan climbing steadily with age. In our model, a healthy man in Pakistan has an expected age at death of about 69.6 at 40, 75.6 at 60 and 86.5 at 80. For a woman the figures are about 73.1, 77.9 and 87.5. These are estimates for people with a healthy BMI who never smoked. Real lives vary widely around them.
So a healthy man who reaches 60 has an expected age at death about 10 years above the at-birth figure for life expectancy in Pakistan. Each decade you survive moves your own estimate up, because the risks you have already passed no longer count against you.
To compare your own age with other countries, see life expectancy by age.
What the chances of reaching 70 and 80 mean
The odds table on this page is for a healthy 40-year-old who never smoked. In our model, about half of such men (51%) reach 70, and about a quarter (24%) reach 80. For women it is 61% and 34%. Only a small share reach 90: 5% of men and 10% of women.
In India the same model gives 63% of men and 69% of women reaching 70. So adult life expectancy in Pakistan is a little shorter too, not only the figure at birth. These are group averages, not a forecast for one person.
Is life expectancy in Pakistan improving?
In our model, a healthy man born in 1990 has an expected age at death of about 69, and a man born in 2010 about 66. That is not a fall. Older people have already survived many risky years, and the table uses today’s death rates for everyone.
Across the world, life expectancy has tended to rise as child deaths fall and adult health care improves. If that continues, life expectancy in Pakistan for children born today is likely to end up higher than the table shows. Our model does not try to predict that.
What people in Pakistan can control
Nobody can change life expectancy in Pakistan as a whole. You can change the habits that sit behind the biggest causes of adult death in Pakistan: heart disease and stroke. None of these steps need expensive equipment.
- Know your blood pressure. High blood pressure often has no symptoms. It can be checked at a clinic, a pharmacy or with a home monitor. If it is high, see a doctor.
- Drop every form of tobacco. Cigarettes, huqqa, naswar, gutka and paan with tobacco all harm health. Our page on smoking and life expectancy shows that quitting at any age helps.
- Check blood sugar. Diabetes is common in South Asia and often found late. A simple test can pick it up early.
- Watch your waist and weight. South Asians face higher risk at lower weights, so the lower Asian BMI cut-offs are a better guide. See BMI and life expectancy.
- Move every day. Brisk walking counts. So does climbing stairs and carrying shopping.
- Cut back on salt, ghee and fried food. Cooking with less salt and oil helps blood pressure and weight.
- Keep smoke out of the home. Where wood, dung or other solid fuels are used for cooking, a chimney, an open window or cooking outside cuts smoke.
The calculator above shows how much each one changes your own estimate, starting from life expectancy in Pakistan for your age and sex.
How to use life expectancy in Pakistan figures calmly
Numbers about death can be unsettling. Keep three points in mind. The figures are averages for large groups. Adults can expect to live longer than the at-birth figure. And the ranges around any estimate are wide, often 15 to 20 years.
If thinking about this makes you anxious, our page on coping with death anxiety has calm, practical steps. If a health worry is behind the question, the most useful step is a check-up with a doctor.
Frequently asked questions
What is the average life expectancy in Pakistan?
According to UN World Population Prospects 2024, life expectancy at birth in Pakistan was about 65.3 years for men and 70.2 years for women in 2023. Adults who have already passed childhood and young adulthood can expect to live longer than these figures.
How long do men live in Pakistan?
Men in Pakistan have a life expectancy at birth of about 65.3 years. In our model, a healthy 40-year-old man who has never smoked has an expected age at death of about 69.6, and a 65-year-old man can expect about 12.8 more years.
How long do women live in Pakistan?
Women in Pakistan have a life expectancy at birth of about 70.2 years. In our model, a healthy 40-year-old woman has an expected age at death of about 73.1, and a 65-year-old woman can expect about 14.7 more years.
Why do women live longer than men in Pakistan?
Women in Pakistan live about 4.8 years longer at birth. In most countries, men smoke and drink more, die more often from injuries and heart disease at younger ages, and see doctors less. Some biological protection for women also plays a part.
How can I estimate my own life expectancy in Pakistan?
Use the calculator on this page. It starts from the UN figure for Pakistan, adjusts for your age and sex, and applies published effects of BMI, smoking, alcohol, activity, diet and outlook. Everything runs in your browser and nothing is stored.
Does Pakistan publish an official national life table?
We could not verify a regular national life table for Pakistan. So the figures for life expectancy in Pakistan on this page come from UN World Population Prospects 2024 (2023 estimates), which draw on census and survey data plus statistical models. Treat them as the best available national average, not a measured count, and expect real figures to vary by province and income.
Why is life expectancy in Pakistan lower than in India?
At birth, the UN puts men in India about 5.2 years ahead of men in Pakistan and women about 3.4 years ahead. By 65 the gap falls to under 2 years, so most of the difference comes from deaths in childhood and younger adulthood. See life expectancy in India for that country’s figures.
What is the life expectancy of a 60-year-old in Pakistan?
In our model, a healthy 60-year-old man in Pakistan who never smoked has an expected age at death of about 75.6, with about 15.6 years left. A woman of 60 has about 17.9 years left, an expected age of about 77.9. These are group averages, and many people live well past them.
What are the chances of reaching 80 in Pakistan?
For a healthy 40-year-old who never smoked, our model gives men about a 24% chance of reaching 80 and women about 34%. Reaching 70 is more likely: 51% for men and 61% for women. Avoiding tobacco and keeping blood pressure in check are among the most useful steps. Try the death clock calculator for your own estimate.
Compare Pakistan with every other country on life expectancy by country, or go back to the death clock calculator.
See your own estimate in 30 seconds
Free, private and based on UN 2024 data for 201 countries. Nothing you enter is stored.
Open the death clock →