
Life Expectancy in The United Kingdom
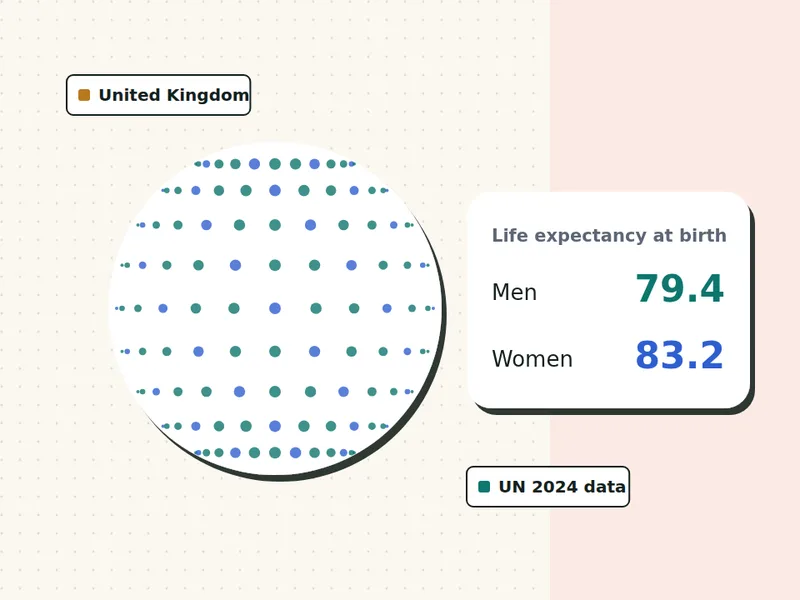
Life expectancy in the United Kingdom is about 79.4 years for men and 83.2 years for women at birth, according to UN World Population Prospects 2024 (2023 estimates). Adults can expect to live longer than that: a healthy 40-year-old man in the United Kingdom has an expected age at death of about 80.8, and a woman about 84.1. Use the calculator for your own estimate.
UN World Population Prospects 2024, 2023 estimates
- UN 2024 data, 201 countries
- Nothing stored or sent
- Free, no sign-up
On this page
What is the life expectancy in the United Kingdom?
At birth, life expectancy in the United Kingdom is 79.4 years for men and 83.2 years for women, a gap of 3.8 years. Among the 201 countries and territories in the UN data, that ranks the United Kingdom number 32 for men and 39 for women. These are period figures: how long a baby would live if today’s death rates never changed.
Life expectancy in the UK rose for decades, then slowed after about 2011 and dipped during the pandemic. The ONS says female life expectancy has now returned to pre-pandemic levels, while male life expectancy is still slightly below. There are large gaps between the richest and poorest areas.
What do official statistics in the United Kingdom say?
The Office for National Statistics (ONS) reported life expectancy at birth of 79.1 years for males and 83.0 years for females for 2022 to 2024. At age 65, males could expect another 18.7 years and females 21.2 years.
Source: ONS, National life tables: UK, 2022 to 2024.
National offices often publish newer years or use different methods, so their figures can differ a little from the UN’s. We use the UN figures on our calculator so every country is measured the same way. Read more on data and sources.
Life expectancy by age in the United Kingdom
Your life expectancy rises as you get older, because you have already survived the years that pull the average down. The chart and table show our model for healthy non-smokers in the United Kingdom.
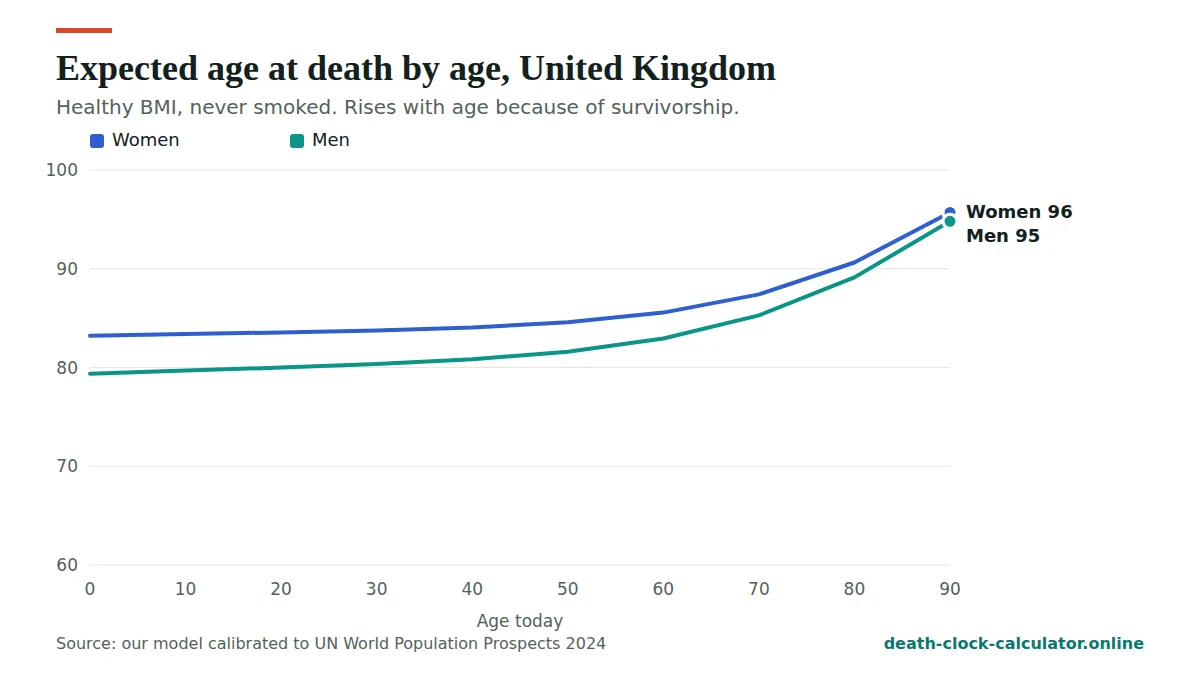
| Age today | Men: years left | Men: expected age at death | Women: years left | Women: expected age at death |
|---|---|---|---|---|
| 0 | 79.4 | 79.4 | 83.2 | 83.2 |
| 10 | 69.7 | 79.7 | 73.4 | 83.4 |
| 20 | 60.0 | 80.0 | 63.6 | 83.6 |
| 30 | 50.4 | 80.4 | 53.8 | 83.8 |
| 40 | 40.8 | 80.8 | 44.1 | 84.1 |
| 50 | 31.6 | 81.6 | 34.6 | 84.6 |
| 60 | 22.9 | 82.9 | 25.6 | 85.6 |
| 70 | 15.3 | 85.3 | 17.4 | 87.4 |
| 80 | 9.1 | 89.1 | 10.6 | 90.6 |
| 90 | 4.8 | 94.8 | 5.7 | 95.7 |
At 65, a healthy man in the United Kingdom can expect about 19.0 more years and a woman about 21.3, in our model.
What are the chances of living to 90 in the United Kingdom?
For a healthy 40-year-old who has never smoked, our model gives about a 24% chance of reaching 90 for men and 35% for women. Here are the odds for other ages:
| Group | Reach 70 | Reach 80 | Reach 90 | Reach 100 |
|---|---|---|---|---|
| Men | 82% | 59% | 24% | 2% |
| Women | 87% | 68% | 35% | 6% |
What age will people born in the United Kingdom live to?
This table shows the expected age at death and the projected year of death for people born in different years, calculated in September 2026 with today’s death rates. People born recently will probably live longer than shown, as health keeps improving.
| Born in | Men: age | Men: year | Women: age | Women: year |
|---|---|---|---|---|
| 1950 | 87 | 2037 | 89 | 2039 |
| 1960 | 84 | 2044 | 87 | 2047 |
| 1970 | 82 | 2052 | 85 | 2055 |
| 1980 | 81 | 2061 | 84 | 2064 |
| 1990 | 81 | 2071 | 84 | 2074 |
| 2000 | 80 | 2080 | 84 | 2084 |
| 2010 | 80 | 2090 | 83 | 2093 |
What are the leading causes of death in the United Kingdom?
| Group | Leading causes |
|---|---|
| Men 50 to 69 | Heart disease 15.7%, COVID-19 8.7%, lung cancer 7.7% |
| Men 70 and over | COVID-19 12.3%, heart disease 11.9%, dementias 11.5% |
| Women 50 to 69 | Lung cancer 9.9%, breast cancer 8.2%, heart disease 7.2% |
| Women 70 and over | Dementias 19.8%, COVID-19 10.0%, heart disease 8.3% |
2021 was a pandemic year, so COVID-19 ranks higher than it does now. For every age group and country, use our causes of death tool.
What would add the most years in the United Kingdom?
In the UK, cancers and dementia are major causes of death at older ages. Not smoking, a healthy weight and regular activity cut the risk of many of them, and the NHS offers free stop-smoking support and health checks.
Run the calculator above and open “What moves your estimate” to see how many years each change is worth for you. Our guide to how to live longer has the evidence for each habit.
How UK life expectancy compares with western Europe
Britain is often compared with its closest neighbours, so here is life expectancy in the United Kingdom next to eleven other western European countries. The last two columns show the extra years a person can expect once they reach 65. All figures are from UN World Population Prospects 2024 (2023 estimates).
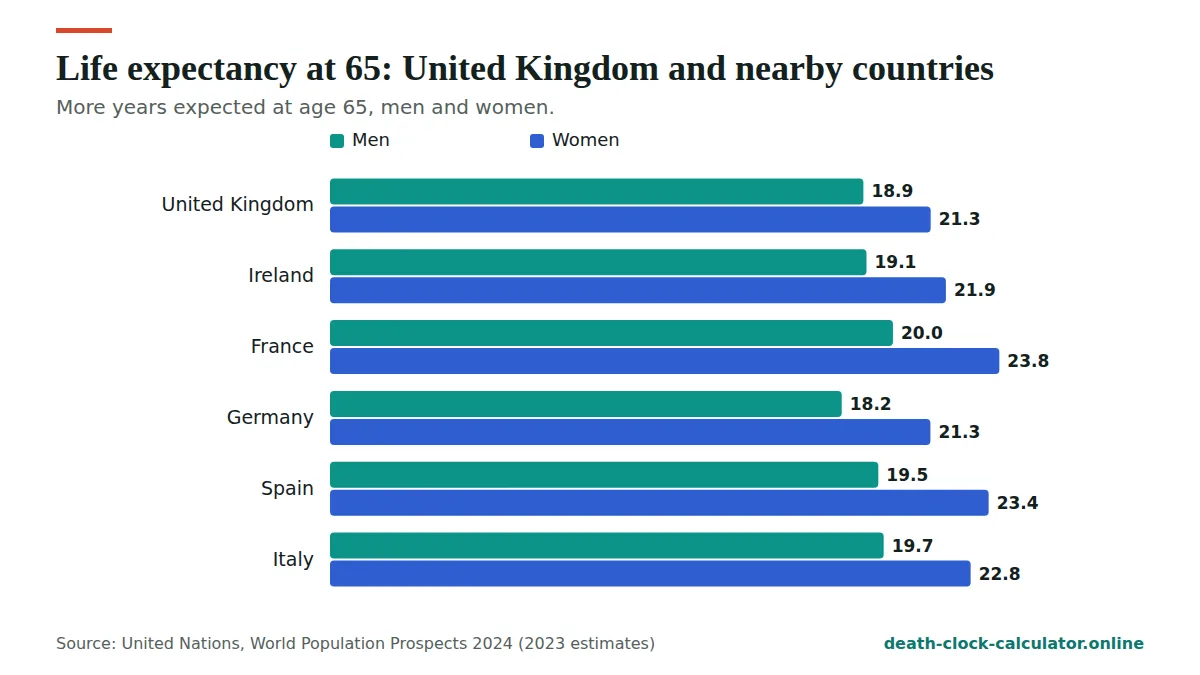
| Country | Men at birth | Women at birth | Men at 65 | Women at 65 |
|---|---|---|---|---|
| United Kingdom | 79.4 | 83.2 | 19.0 | 21.3 |
| Ireland | 80.4 | 84.5 | 19.1 | 21.9 |
| France | 80.4 | 86.1 | 20.0 | 23.8 |
| Germany | 79.0 | 83.8 | 18.2 | 21.3 |
| Netherlands | 80.5 | 83.7 | 18.8 | 21.3 |
| Belgium | 79.9 | 84.3 | 18.8 | 22.0 |
| Spain | 81.0 | 86.3 | 19.5 | 23.4 |
| Italy | 81.6 | 85.8 | 19.7 | 22.8 |
| Sweden | 81.4 | 85.1 | 19.6 | 22.2 |
| Norway | 81.8 | 84.8 | 19.6 | 21.8 |
| Denmark | 80.0 | 83.8 | 18.4 | 21.2 |
| Switzerland | 82.0 | 85.8 | 20.1 | 22.8 |
Of the twelve countries, only Germany has a lower figure than UK life expectancy for men at birth. For women, UK life expectancy at birth is the lowest in the table. British women can expect about 2.9 fewer years than women in France and 3.1 fewer than women in Spain.
We worked out the average of the eleven other countries. At birth, life expectancy in the United Kingdom is about 1.4 years below that average for men and 1.7 years below for women. At 65 the shortfall is much smaller: about 0.3 years for men and 0.9 years for women.
So life expectancy in the United Kingdom does not trail its neighbours by much once people reach retirement age. A British man of 65 can expect about as many years as an Irish or Dutch man, and more than a German or Danish man. Most of the difference at birth builds up earlier in life. In the world ranking, the UK is number 32 of 201 for men at birth and about 28 for years left at 65. These are our own calculations from the UN data.
Reading the ONS life tables
The Office for National Statistics figures for life expectancy in the United Kingdom quoted above cover three years together, 2022 to 2024. Pooling three years of deaths makes UK life expectancy figures steadier, because one unusual year (a bad winter, for example) does not swing the result much.
Here is how the three sources on this page line up for someone aged 65:
| Source | Men at 65 | Women at 65 |
|---|---|---|
| ONS, 2022 to 2024 | 18.7 | 21.2 |
| UN, 2023 | 19.0 | 21.3 |
| Our model | 19.0 | 21.3 |
At birth, the ONS gives 79.1 years for males and 83.0 for females, against the UN’s 79.4 and 83.2. The sources agree to within about a third of a year. That is reassuring for anyone checking life expectancy in the United Kingdom. It means the UK life expectancy figure you see here is not an outlier, whichever source you trust.
Remember that the ONS and UN both measure period UK life expectancy. They assume today’s death rates never change, which almost never happens. Our data and sources page lists every figure we use and where it comes from.
Average life expectancy UK adults can expect, from 45 to 85
The age table higher up shows life expectancy in the United Kingdom every ten years. This one fills in the ages between and adds a column that people often ask about: how far your expected age sits above the headline figure at birth. The figures are estimates from our model for people with a healthy BMI who have never smoked.
| Age today | Men: expected age | Men: above at-birth figure | Women: expected age | Women: above at-birth figure |
|---|---|---|---|---|
| 45 | 81.2 | +1.8 | 84.3 | +1.1 |
| 55 | 82.2 | +2.8 | 85.0 | +1.8 |
| 65 | 84.0 | +4.6 | 86.3 | +3.1 |
| 75 | 87.0 | +7.6 | 88.8 | +5.6 |
| 85 | 91.7 | +12.3 | 92.9 | +9.7 |
A woman who has reached 80 in the UK has an expected age of about 90.6 in our model, which is 7.4 years above the at-birth figure of 83.2. A woman of 60 has an expected age of about 85.6. The older you are, the less the headline UK life expectancy number tells you.
These UK life expectancy figures are averages for groups, and the real spread is wide. Some people live many years past them and some die well before. Our page on life expectancy by age explains why the estimate climbs as you get older.
Two habits that shift UK life expectancy the most
Our model uses published research to show how much smoking and weight change an estimate of life expectancy in the United Kingdom. Both tables below use UK figures, so they fit this page directly.
Stopping smoking
This table is for a British man who has smoked for 30 years or more and has a healthy BMI. It compares smoking for life with stopping at different ages.
| Quit at age | If you keep smoking | If you quit | Years gained |
|---|---|---|---|
| 30 | 70.3 | 80.4 | +10.1 |
| 40 | 71.1 | 80.3 | +9.3 |
| 50 | 72.4 | 78.2 | +5.8 |
| 60 | 74.9 | 77.8 | +2.9 |
| 70 | 78.8 | 79.7 | +0.8 |
Stopping by 40 gives back most of the lost years. Stopping at 60 still adds nearly three. The NHS stop-smoking support mentioned above is free. More detail is on smoking and life expectancy.
Weight
For a 40-year-old in the United Kingdom who never smoked, our model gives these changes compared with a BMI of 20 to 24.9:
- BMI 25 to 27.4: about 0.7 years fewer for men and 0.6 for women.
- BMI 30 to 34.9: about 3.6 years fewer for men and 3.5 for women.
- BMI 35 to 39.9: about 6.3 years fewer for men and 6.2 for women.
- BMI 40 or more: about 9.6 years fewer for men and 9.5 for women.
- BMI under 18.5: about 3.9 years fewer for both.
These use hazard ratios from the Global BMI Mortality Collaboration (Lancet, 2016). The page on BMI and life expectancy explains what they mean.
The gap between men and women in the UK
At birth, UK life expectancy for women is about 3.8 years longer than for men. That is a smaller gap than the average of 5.2 years across the 201 countries in the UN data, and smaller than in the United States (5.0) or France (5.7). Among the European countries in the table above, only Norway and the Netherlands have a clearly smaller gap.
The gap in UK life expectancy between the sexes narrows further with age. At 65, UN data give women about 2.4 more years than men. In our model, the gap for healthy adults is 3.3 years at 40 and only 1.5 years at 80. For a healthy 40-year-old, the chance of reaching 90 is about 24% for men and 35% for women.
What else you can do
Most of what lifts life expectancy in the United Kingdom for one person is simple and not new:
- Go to your NHS Health Check when you are invited, and get your blood pressure checked. Many pharmacies do this too.
- Keep alcohol within the low-risk guidelines and have some alcohol-free days each week.
- Move more. Brisk walking counts, and so does taking the stairs.
- Go for the cancer screening you are invited to.
- See your GP soon about a lump, a cough that will not clear, blood where it should not be, or weight loss you cannot explain.
Run the death clock calculator to see your own estimate for life expectancy in the United Kingdom. If thinking about these numbers makes you anxious, our death anxiety help page has calm, practical ideas.
Frequently asked questions
What is the average life expectancy in the United Kingdom?
According to UN World Population Prospects 2024, life expectancy at birth in the United Kingdom was about 79.4 years for men and 83.2 years for women in 2023. Adults who have already passed childhood and young adulthood can expect to live longer than these figures.
How long do men live in the United Kingdom?
Men in the United Kingdom have a life expectancy at birth of about 79.4 years. In our model, a healthy 40-year-old man who has never smoked has an expected age at death of about 80.8, and a 65-year-old man can expect about 19.0 more years.
How long do women live in the United Kingdom?
Women in the United Kingdom have a life expectancy at birth of about 83.2 years. In our model, a healthy 40-year-old woman has an expected age at death of about 84.1, and a 65-year-old woman can expect about 21.3 more years.
Why do women live longer than men in the United Kingdom?
Women in the United Kingdom live about 3.8 years longer at birth. In most countries, men smoke and drink more, die more often from injuries and heart disease at younger ages, and see doctors less. Some biological protection for women also plays a part.
How can I estimate my own life expectancy in the United Kingdom?
Use the calculator on this page. It starts from the UN figure for the United Kingdom, adjusts for your age and sex, and applies published effects of BMI, smoking, alcohol, activity, diet and outlook. Everything runs in your browser and nothing is stored.
Is UK life expectancy lower than in the rest of Europe?
A little, at birth. In UN World Population Prospects 2024 (2023 estimates), UK life expectancy is about 1.4 years below the average of eleven western European countries for men and 1.7 years for women. At 65 the gap is much smaller, about 0.3 years for men. See life expectancy by country.
How long will I live after 65 in the UK?
The ONS gives 18.7 more years for men and 21.2 for women at 65, for 2022 to 2024. The UN and our model give about 19.0 and 21.3. These are averages for groups, not a personal UK life expectancy. Your own figure depends on your health, and many people live well beyond them.
How many years does stopping smoking add in the UK?
In our model, a British man who has smoked for 30 years or more gains about 10.1 years by stopping at 30, 9.3 at 40, 5.8 at 50 and 2.9 at 60, compared with smoking for life. The NHS offers free support to stop. Read more on smoking and life expectancy.
What is the average life expectancy UK women can expect at 80?
In our model, a healthy woman of 80 in the UK who has never smoked has an expected age at death of about 90.6, or about 10.6 more years. That is 7.4 years above the at-birth figure for women, because she has already lived through the years that pull the average down.
Compare the United Kingdom with every other country on life expectancy by country, or go back to the death clock calculator.
See your own estimate in 30 seconds
Free, private and based on UN 2024 data for 201 countries. Nothing you enter is stored.
Open the death clock →